It hasn't been a great afternoon session for Prudential Financial investors, who have watched their shares sink by -2.9% to a price of $105.42. Some of you might be wondering if it's time to buy the dip. If you are considering this, make sure to check the company's fundamentals first to determine if the shares are fairly valued at today's prices.
Prudential Financial's Valuation Is in Line With Its Sector Averages:
Prudential Financial, Inc., together with its subsidiaries, provides insurance, investment management, and other financial products and services in the United States and internationally. The company belongs to the Finance sector, which has an average price to earnings (P/E) ratio of 12.38 and an average price to book (P/B) ratio of 1.58. In contrast, Prudential Financial has a trailing 12 month P/E ratio of 15.6 and a P/B ratio of 1.36.
When we dividePrudential Financial's P/E ratio by its expected five-year EPS growth rate, we obtain a PEG ratio of 0.69, which indicates that the market is undervaluing the company's projected growth (a PEG ratio of 1 indicates a fairly valued company). Your analysis of the stock shouldn't end here. Rather, a good PEG ratio should alert you that it may be worthwhile to take a closer look at the stock.
The Business Runs With Low Leverage Levels:
| 2018 | 2019 | 2020 | 2021 | 2022 | 2023 | |
|---|---|---|---|---|---|---|
| Revenue (MM) | $62,992 | $64,807 | $57,033 | $70,934 | $60,050 | $55,497 |
| Revenue Growth | n/a | 2.88% | -12.0% | 24.37% | -15.34% | -7.58% |
| Net Margins | 6% | 6% | -1% | 11% | -2% | 2% |
| Net Income (MM) | $4,074 | $4,186 | -$374 | $7,724 | -$1,438 | $1,328 |
| Earnings Per Share | $9.5 | $10.11 | -$1.0 | $19.51 | -$3.93 | $3.45 |
| EPS Growth | n/a | 6.42% | -109.89% | 2051.0% | -120.14% | 187.79% |
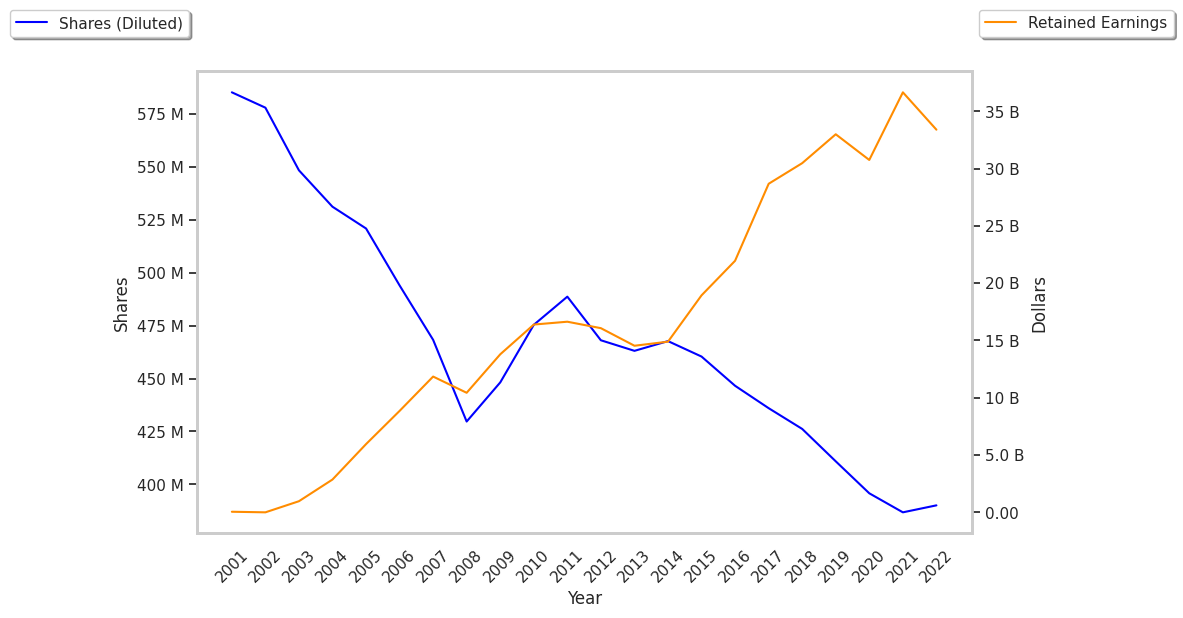
| Diluted Shares (MM) | 426 | 411 | 396 | 390 | 372 | 363 |
| Free Cash Flow (MM) | $21,664 | $19,625 | $8,368 | $9,812 | $5,158 | $4,785 |
| Current Ratio | 6.26 | 8.45 | 14.81 | 17.85 | 22.26 | 27.47 |
| Total Debt (MM) | $19,829 | $20,579 | $20,643 | $19,344 | $20,683 | $615 |
| Net Debt / EBITDA | 0.9 | 0.77 | 51.81 | 0.67 | -2.08 | -10.48 |
Prudential Financial has weak operating margins with a negative growth trend, declining EPS growth, and positive cash flows. On the other hand, the company benefits from an excellent current ratio of 27.47 and low leverage levels.