Agilent Technologies shares fell by -2.2% during the day's afternoon session, and are now trading at a price of $132.36. Is it time to buy the dip? To better answer that question, it's essential to check if the market is valuing the company's shares fairly in terms of its earnings and equity levels.
Trades Below Its Graham Number but Has an Elevated P/B Ratio:
Agilent Technologies, Inc. provides application focused solutions to the life sciences, diagnostics, and applied chemical markets worldwide. The company belongs to the Industrials sector, which has an average price to earnings (P/E) ratio of 22.19 and an average price to book (P/B) ratio of 4.06. In contrast, Agilent Technologies has a trailing 12 month P/E ratio of 31.5 and a P/B ratio of 6.62.
Agilent Technologies's PEG ratio is 2.59, which shows that the stock is probably overvalued in terms of its estimated growth. For reference, a PEG ratio near or below 1 is a potential signal that a company is undervalued.
Strong Revenue Growth and Healthy Leverage Levels:
| 2017 | 2018 | 2019 | 2020 | 2021 | 2022 | |
|---|---|---|---|---|---|---|
| Revenue (M) | $4,472 | $4,914 | $5,163 | $5,339 | $6,319 | $6,848 |
| Operating Margins | 18% | 18% | 18% | 16% | 21% | 24% |
| Net Margins | 15% | 6% | 21% | 13% | 19% | 18% |
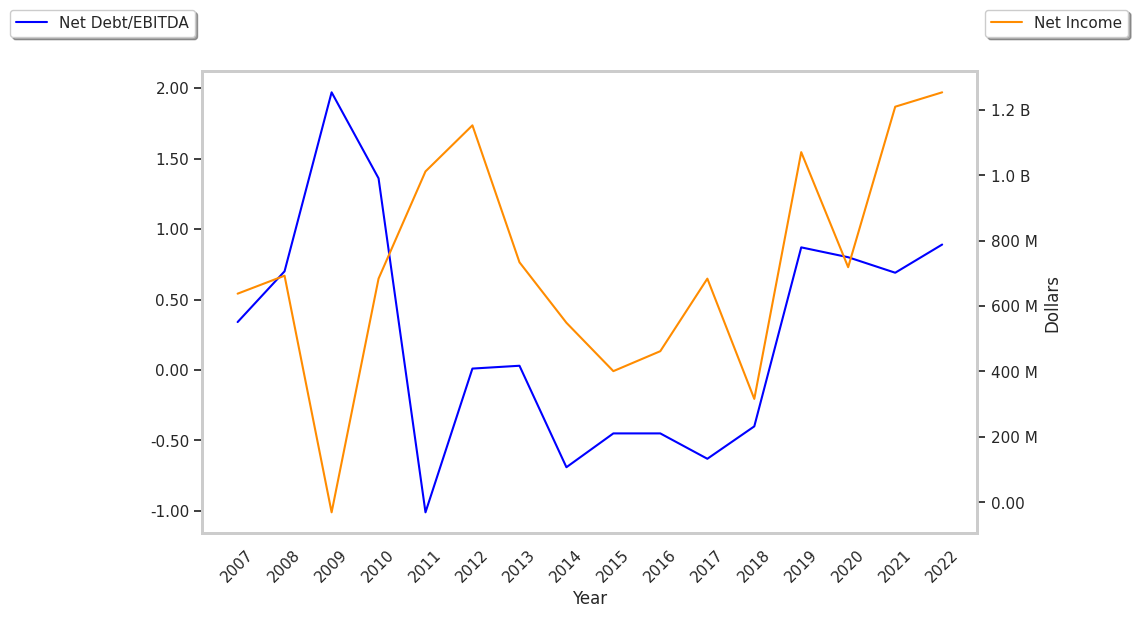
| Net Income (M) | $684 | $316 | $1,071 | $719 | $1,210 | $1,254 |
| Net Interest Expense (M) | $79 | $75 | $74 | $78 | $81 | $84 |
| Depreciation & Amort. (M) | $212 | $210 | $238 | $308 | $321 | $317 |
| Diluted Shares (M) | 326 | 325 | 318 | 312 | 307 | 300 |
| Earnings Per Share | $2.1 | $0.97 | $3.37 | $2.3 | $3.94 | $4.18 |
| EPS Growth | n/a | -53.81% | 247.42% | -31.75% | 71.3% | 6.09% |
| Avg. Price | $62.24 | $64.69 | $73.1 | $90.72 | $142.77 | $128.75 |
| P/E Ratio | 29.36 | 66.01 | 21.44 | 38.94 | 35.87 | 30.73 |
| CAPEX (M) | $176 | $177 | $155 | $119 | $188 | $291 |
| EV / EBITDA | 19.06 | 18.09 | 20.1 | 24.92 | 26.6 | 20.59 |
| Total Debt (M) | $2,000 | $1,792 | $2,402 | $2,359 | $2,729 | $2,769 |
| Net Debt / EBITDA | -0.67 | -0.41 | 0.87 | 0.8 | 0.75 | 0.89 |
| Current Ratio | 3.3 | 3.33 | 1.53 | 2.33 | 2.22 | 2.03 |
Agilent Technologies benefits from rapidly growing revenues and increasing reinvestment in the business, strong operating margins with a positive growth rate, and an excellent current ratio of 2.03. The company's financial statements show a strong EPS growth trend and healthy leverage levels.