We've been asking ourselves recently if the market has placed a fair valuation on Intel. Let's dive into some of the fundamental values of this Large-Cap Technology company to determine if there might be an opportunity here for value-minded investors.
Intel's Valuation Is in Line With Its Sector Averages:
Intel Corporation designs, develops, manufactures, markets, and sells computing and related products and services worldwide. The company belongs to the Technology sector, which has an average price to earnings (P/E) ratio of 35.0 and an average price to book (P/B) ratio of 7.92. In contrast, Intel has a trailing 12 month P/E ratio of 108.0 and a P/B ratio of 1.73.
When we divideIntel's P/E ratio by its expected five-year EPS growth rate, we obtain a PEG ratio of 0.86, which indicates that the market is undervaluing the company's projected growth (a PEG ratio of 1 indicates a fairly valued company). Your analysis of the stock shouldn't end here. Rather, a good PEG ratio should alert you that it may be worthwhile to take a closer look at the stock.
Healthy Leverage Levels but a Declining EPS Growth Trend:
| 2018 | 2019 | 2020 | 2021 | 2022 | 2023 | |
|---|---|---|---|---|---|---|
| Revenue (M) | $70,848 | $71,965 | $77,867 | $79,024 | $63,054 | $52,864 |
| Gross Margins | 62% | 59% | 56% | 55% | 43% | 38% |
| Net Margins | 30% | 28% | 27% | 25% | 13% | -3% |
| Net Income (M) | $21,053 | $21,048 | $20,899 | $19,868 | $8,014 | -$1,644 |
| Net Interest Expense (M) | $126 | $484 | -$504 | -$482 | $1,166 | $662 |
| Depreciation & Amort. (M) | $7,520 | $9,204 | $10,482 | $9,953 | $11,128 | $8,572 |
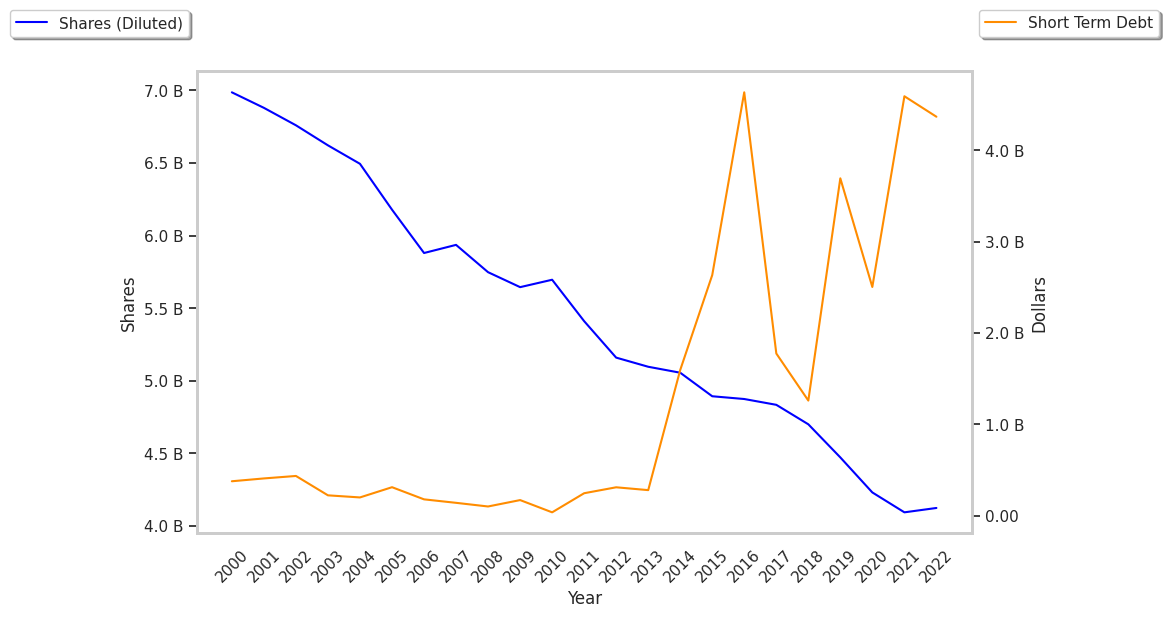
| Diluted Shares (M) | 4,701 | 4,473 | 4,232 | 4,090 | 4,123 | 4,229 |
| Earnings Per Share | $4.48 | $4.71 | $4.94 | $4.86 | $1.94 | -$0.42 |
| EPS Growth | n/a | 5.13% | 4.88% | -1.62% | -60.08% | -121.65% |
| Avg. Price | $42.59 | $45.74 | $49.98 | $52.18 | $43.95 | $42.98 |
| P/E Ratio | 9.32 | 9.59 | 10.04 | 10.67 | 22.54 | -102.33 |
| CAPEX (M) | $15,181 | $16,213 | $14,259 | $18,733 | $24,844 | $24,753 |
| EV / EBITDA | 7.23 | 7.5 | 7.22 | 8.5 | 15.62 | 34.86 |
| Total Debt (M) | $27,120 | $32,696 | $38,905 | $42,692 | $42,474 | $2,288 |
| Net Debt / EBITDA | 0.78 | 0.91 | 0.97 | 1.29 | 2.33 | -1.08 |
| Current Ratio | 1.73 | 1.4 | 1.91 | 2.13 | 1.57 | 1.53 |