It hasn't been a great morning session for Cummins investors, who have watched their shares sink by -2.1% to a price of $264.62. Some of you might be wondering if it's time to buy the dip. If you are considering this, make sure to check the company's fundamentals first to determine if the shares are fairly valued at today's prices.
Cummins's Valuation Is in Line With Its Sector Averages:
Cummins Inc. designs, manufactures, distributes, and services diesel and natural gas engines, electric and hybrid powertrains, and related components worldwide. The company belongs to the Industrials sector, which has an average price to earnings (P/E) ratio of 22.19 and an average price to book (P/B) ratio of 4.06. In contrast, Cummins has a trailing 12 month P/E ratio of 51.3 and a P/B ratio of 4.24.
Cummins's PEG ratio is 2.08, which shows that the stock is probably overvalued in terms of its estimated growth. For reference, a PEG ratio near or below 1 is a potential signal that a company is undervalued.
Strong Revenue Growth but Slimmer Gross Margins to the Industry Average of 34.2%:
| 2018 | 2019 | 2020 | 2021 | 2022 | 2023 | |
|---|---|---|---|---|---|---|
| Revenue (M) | $23,771 | $23,571 | $19,811 | $24,021 | $28,074 | $33,292 |
| Gross Margins | 24% | 25% | 25% | 24% | 24% | 24% |
| Net Margins | 9% | 10% | 9% | 9% | 8% | 9% |
| Net Income (M) | $2,187 | $2,268 | $1,811 | $2,164 | $2,183 | $2,877 |
| Net Interest Expense (M) | $114 | $109 | $100 | $111 | $199 | $370 |
| Depreciation & Amort. (M) | $611 | $672 | $673 | $662 | $784 | $1,000 |
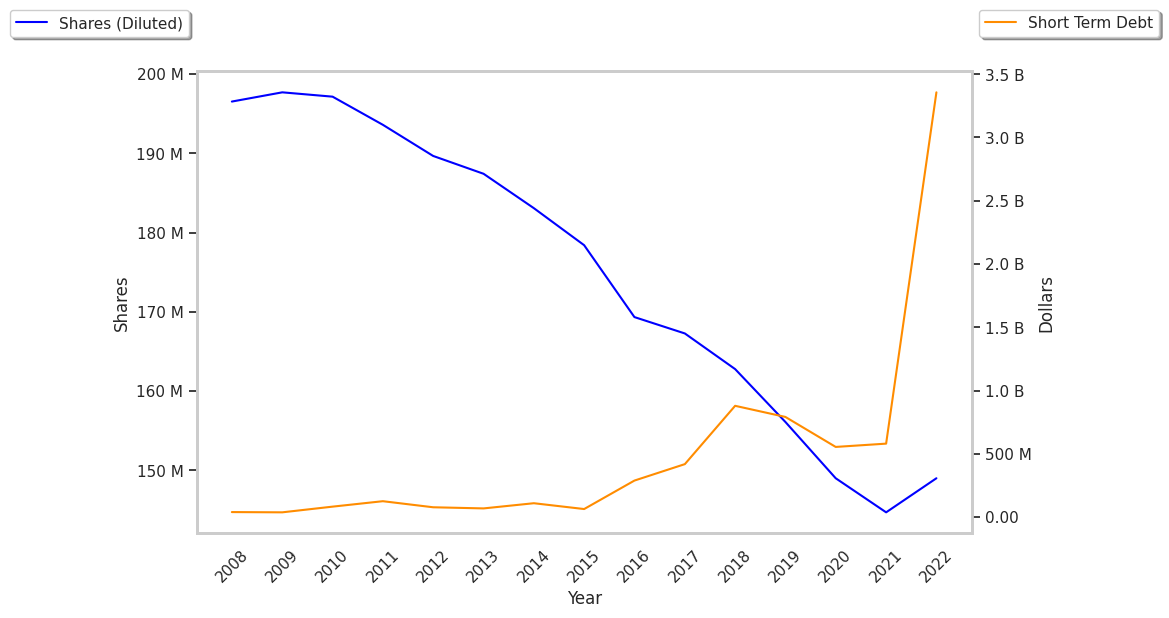
| Diluted Shares (M) | 163 | 156 | 149 | 146,000,000,000 | 142 | 143 |
| Earnings Per Share | $13.15 | $14.48 | $12.01 | $0.0 | $15.12 | $19.63 |
| EPS Growth | n/a | 10.11% | -17.06% | -100.0% | n/a | 29.83% |
| Avg. Price | $131.18 | $146.05 | $171.67 | $229.34 | $200.76 | $264.47 |
| P/E Ratio | 9.94 | 10.04 | 14.22 | 15.56 | 13.21 | 13.39 |
| CAPEX (M) | $709 | $700 | $528 | $734 | $916 | $1,157 |
| Total Debt (M) | $1,642 | $1,607 | $3,672 | $3,638 | $5,071 | $4,950 |
| Net Debt / EBITDA | 0.1 | 0.14 | 0.09 | 0.31 | 0.82 | 0.54 |
| Current Ratio | 1.54 | 1.5 | 1.88 | 1.74 | 1.27 | 1.43 |
Cummins has rapidly growing revenues and increasing reinvestment in the business, positive EPS growth, and healthy leverage levels. However, the firm has slimmer gross margins than its peers. Finally, we note that Cummins has just enough current assets to cover current liabilities, as shown by its current ratio of 1.43.