Nasdaq logged a 2.4% change during today's morning session, and is now trading at a price of $62.53 per share.
Nasdaq returned gains of 15.3% last year, with its stock price reaching a high of $63.05 and a low of $46.88. Over the same period, the stock underperformed the S&P 500 index by -16.1%. The company's 50-day average price was $57.8. Nasdaq, Inc. operates as a technology company that serves capital markets and other industries worldwide. Based in New York, NY, the Large-Cap Finance company has 8,525 full time employees. Nasdaq has not offered a dividend during the last year.
Strong Revenue Growth and Reasonable Leverage Levels:
| 2018 | 2019 | 2020 | 2021 | 2022 | 2023 | |
|---|---|---|---|---|---|---|
| Revenue (M) | $4,277 | $4,258 | $5,625 | $5,886 | $6,226 | $5,999 |
| Interest Income (M) | $150 | $124 | $101 | $125 | $129 | $206 |
| Operating Margins | 24% | 24% | 22% | 24% | 25% | 26% |
| Net Margins | 11% | 18% | 17% | 20% | 18% | 18% |
| Net Income (M) | $458 | $774 | $933 | $1,187 | $1,125 | $1,103 |
| Depreciation & Amort. (M) | $210 | $190 | $202 | $278 | $258 | $261 |
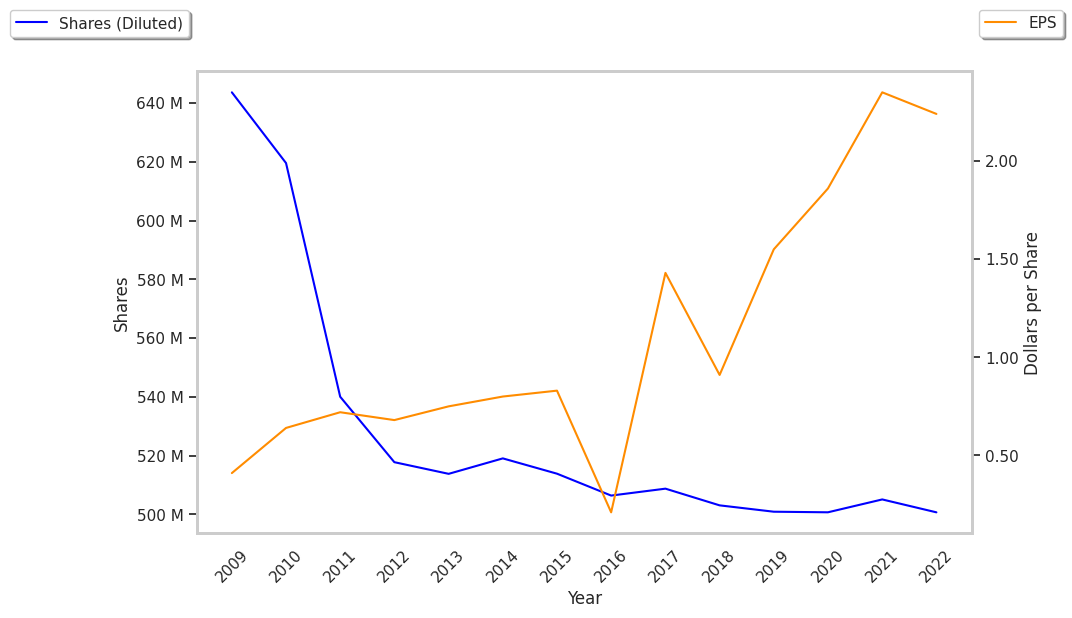
| Diluted Shares (M) | 503 | 501 | 501 | 505 | 498 | 494 |
| Earnings Per Share | $0.91 | $1.55 | $1.86 | $2.35 | $2.26 | $2.23 |
| EPS Growth | n/a | 70.33% | 20.0% | 26.34% | -3.83% | -1.33% |
| Avg. Price | $26.84 | $29.78 | $37.82 | $56.97 | $54.86 | $62.33 |
| P/E Ratio | 29.17 | 19.09 | 20.12 | 23.74 | 24.06 | 27.58 |
| CAPEX (M) | $111 | $127 | $188 | $163 | $152 | $150 |
| EV / EBITDA | 13.0 | 14.78 | 14.57 | 19.26 | 17.54 | 18.99 |
| Total Debt (M) | $3,232 | $3,387 | $4,944 | $5,331 | $5,399 | $9,703 |
| Net Debt / EBITDA | 2.17 | 2.53 | 1.53 | 2.87 | 2.69 | 2.38 |
| Current Ratio | 0.97 | 1.01 | 1.56 | 0.94 | 0.97 | 1.75 |
Nasdaq benefits from rapidly growing revenues and increasing reinvestment in the business, strong operating margins with a stable trend, and a strong EPS growth trend. The company's financial statements show a decent current ratio of 1.75 and reasonable leverage levels.
Trades Below Its Graham Number but Has an Elevated P/B Ratio:
Nasdaq has a trailing twelve month P/E ratio of 27.8, compared to an average of 12.38 for the Finance sector. Based on its EPS guidance of $3.1, the company has a forward P/E ratio of 18.6. According to the 19.1% compound average growth rate of Nasdaq's historical and projected earnings per share, the company's PEG ratio is 1.45. Taking the weighted average of the company's EPS CAGR and the broader market's 5-year projected EPS growth rate, we obtain a normalized growth rate of 13.4%. On this basis, the company's PEG ratio is 2.08. This suggests that these shares are overvalued. Furthermore, Nasdaq is likely overvalued compared to the book value of its equity, since its P/B ratio of 3.33 is higher than the sector average of 1.58. The company's shares are currently trading -59.0% below their Graham number.
Nasdaq Has an Analyst Consensus of Little Upside Potential:
The 14 analysts following Nasdaq have set target prices ranging from $54.0 to $82.0 per share, for an average of $62.36 with a hold rating. The company is trading 0.3% away from its average target price, indicating that there is an analyst consensus of little upside potential.
Nasdaq has a very low short interest because 1.2% of the company's shares are sold short. Institutions own 77.6% of the company's shares, and the insider ownership rate stands at 10.74%, suggesting a large amount of insider shareholders. The largest shareholder is Thoma Bravo, LP, whose 12% stake in the company is worth $4,481,052,098.