It hasn't been a great afternoon session for TC Energy investors, who have watched their shares sink by -1.6% to a price of $39.37. Some of you might be wondering if it's time to buy the dip. If you are considering this, make sure to check the company's fundamentals first to determine if the shares are fairly valued at today's prices.
TC Energy's Valuation Is in Line With Its Sector Averages:
TC Energy Corporation operates as an energy infrastructure company in North America. The company belongs to the Utilities sector, which has an average price to earnings (P/E) ratio of 17.53 and an average price to book (P/B) ratio of 1.71. In contrast, TC Energy has a trailing 12 month P/E ratio of 19.3 and a P/B ratio of 1.51.
When we divide TC Energy's P/E ratio by its expected EPS growth rate of the next five years, we obtain its PEG ratio of -12.15. Since it's negative, the company has negative growth expectations, and most investors will probably avoid the stock unless it has an exceptionally low P/E and P/B ratio.
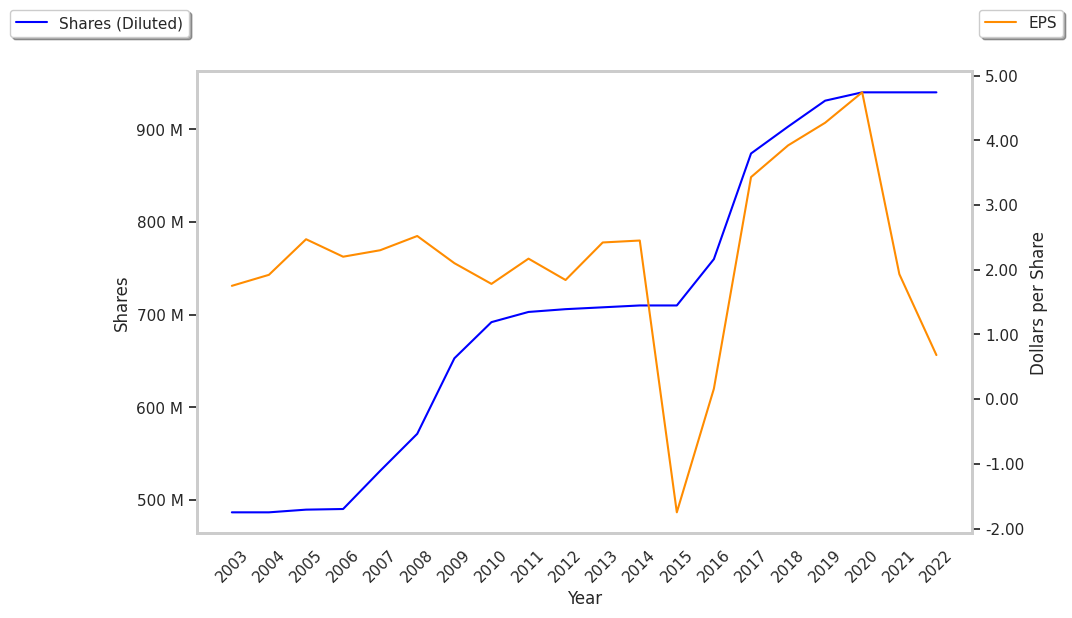
The Firm Has a Declining EPS Growth Trend:
| 2018 | 2019 | 2020 | 2021 | 2022 | 2023 | |
|---|---|---|---|---|---|---|
| Revenue (M) | $13,679 | $13,255 | $12,999 | $13,387 | $14,977 | $15,934 |
| Operating Margins | 42% | 50% | 52% | 30% | 24% | 39% |
| Net Margins | 27% | 31% | 36% | 15% | 5% | 18% |
| Net Income (M) | $3,702 | $4,140 | $4,616 | $1,955 | $748 | $2,922 |
| Net Interest Expense (M) | -$1,815 | -$1,398 | -$1,666 | -$1,893 | -$2,258 | -$2,126 |
| Depreciation & Amort. (M) | $2,350 | $2,464 | $2,590 | $2,522 | $2,584 | $2,778 |
| Diluted Shares (M) | 903 | 931 | 940 | 974 | 996 | 1,030 |
| Earnings Per Share | $3.92 | $4.27 | $4.74 | $1.86 | $0.64 | $2.75 |
| EPS Growth | n/a | 8.93% | 11.01% | -60.76% | -65.59% | 329.69% |
| Avg. Price | $31.43 | $37.47 | $37.52 | $41.72 | $48.94 | $39.445 |
| P/E Ratio | 8.02 | 8.75 | 7.92 | 22.31 | 76.47 | 14.34 |
| CAPEX (M) | $9,418 | $7,475 | $8,900 | $7,134 | $8,961 | $12,298 |
| Current Ratio | 0.4 | 0.59 | 0.43 | 0.57 | 0.43 | 0.96 |