A strong performer from today's afternoon trading session is Apollo Global Management, whose shares rose 3.2% to $114.67 per share. For those of you thinking about investing in the stock, here is a brief value analysis of the stock using the company's basic fundamental ratios.
Apollo Global Management's Valuation Is in Line With Its Sector Averages:
Apollo Global Management, Inc. is a private equity firm specializing in investments in credit, private equity and real estate markets. The company belongs to the Finance sector, which has an average price to earnings (P/E) ratio of 12.38 and an average price to book (P/B) ratio of 1.58. In contrast, Apollo Global Management has a trailing 12 month P/E ratio of 13.8 and a P/B ratio of 5.15.
When we divideApollo Global Management's P/E ratio by its expected five-year EPS growth rate, we obtain a PEG ratio of 0.91, which indicates that the market is undervaluing the company's projected growth (a PEG ratio of 1 indicates a fairly valued company). Your analysis of the stock shouldn't end here. Rather, a good PEG ratio should alert you that it may be worthwhile to take a closer look at the stock.
Generally Positive Cash Flows and a Positive EPS Growth Rate:
| 2021 | 2022 | 2023 | |
|---|---|---|---|
| Revenue (M) | $5,951 | $10,968 | $32,644 |
| Interest Income (M) | $138 | n/a | $145 |
| Operating Margins | 82% | -39% | 17% |
| Net Margins | 31% | -18% | 20% |
| Net Income (M) | $1,839 | -$1,961 | $6,509 |
| Depreciation & Amort. (M) | $27 | $529 | $803 |
| Diluted Shares (M) | 237 | 585 | 589 |
| Earnings Per Share | $7.32 | -$3.43 | $8.28 |
| EPS Growth | n/a | -146.86% | 341.4% |
| Avg. Price | $56.15 | $57.82 | $114.67 |
| P/E Ratio | 7.67 | -16.86 | 13.78 |
| Free Cash Flow (M) | $1,064 | $3,789 | $6,322 |
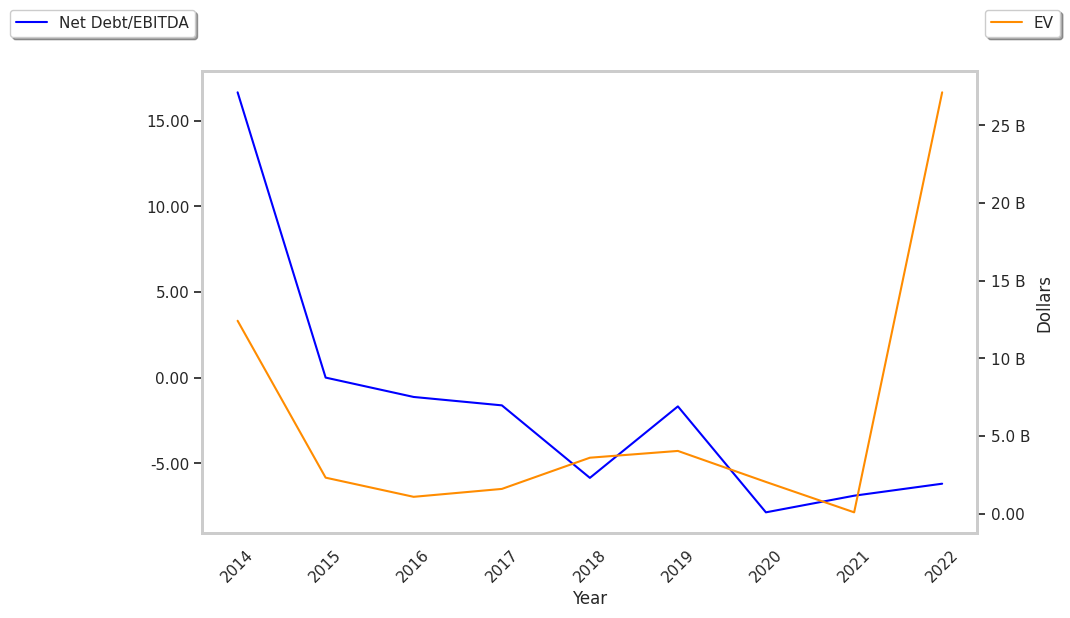
| EV / EBITDA | 3.17 | -8.42 | 9.62 |
| Total Debt (M) | $3,134 | $6,472 | $8,092 |
| Net Debt / EBITDA | 0.45 | 0.67 | -0.62 |
Apollo Global Management has generally positive cash flows, low leverage levels, and positive EPS growth. Furthermore, Apollo Global Management has decent operating margins with a negative growth trend.