CVS Health logged a -3.0% change during today's afternoon session, and is now trading at a price of $71.19 per share.
Over the last year, CVS Health logged a -2.1% change, with its stock price reaching a high of $83.25 and a low of $64.41. Over the same period, the stock underperformed the S&P 500 index by -29.4%. AThe company's 50-day average price was $75.89. CVS Health Corporation provides health solutions in the United States. Based in Woonsocket, RI, the Large-Cap Consumer Staples company has 219,000 full time employees. CVS Health has offered a 3.3% dividend yield over the last 12 months.
Growing Revenues but Not Enough Current Assets to Cover Current Liabilities:
| 2018 | 2019 | 2020 | 2021 | 2022 | 2023 | |
|---|---|---|---|---|---|---|
| Revenue (M) | $194,579 | $256,776 | $268,706 | $292,111 | $322,467 | $357,776 |
| Operating Margins | 2% | 5% | 5% | 5% | 2% | 4% |
| Net Margins | 0% | 3% | 3% | 3% | 1% | 2% |
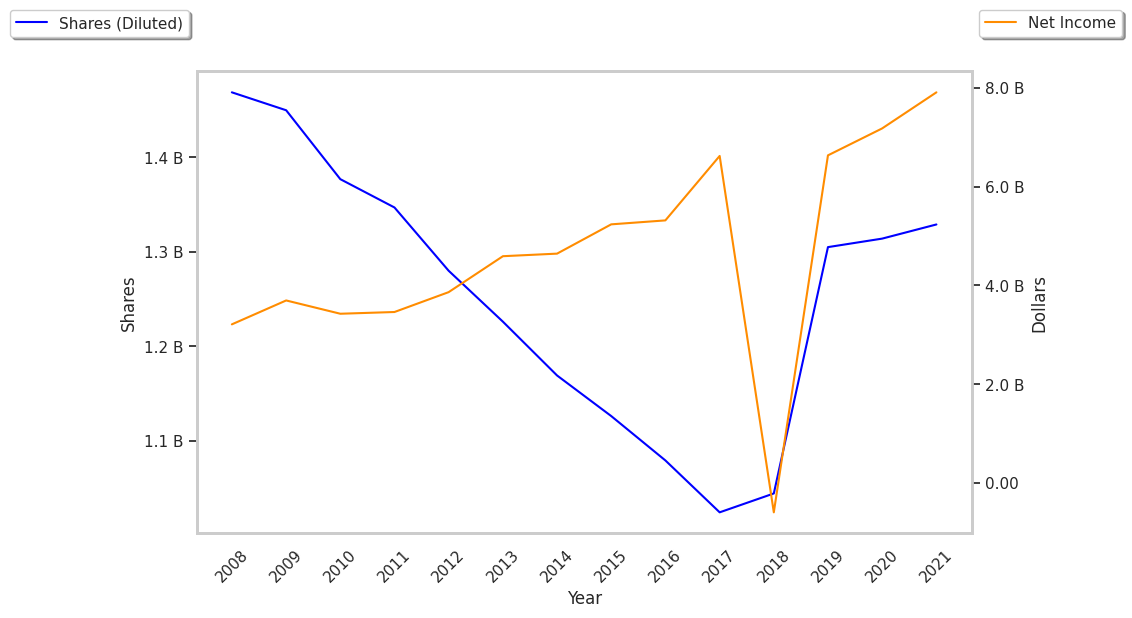
| Net Income (M) | -$594 | $6,634 | $7,179 | $8,001 | $4,311 | $8,344 |
| Net Interest Expense (M) | $2,619 | $3,035 | $2,907 | $2,503 | $2,287 | $2,658 |
| Depreciation & Amort. (M) | $2,718 | $4,371 | $4,441 | $4,486 | $4,224 | $4,366 |
| Diluted Shares (M) | 1,044 | 1,305 | 1,314 | 1,329 | 1,323 | 1,290 |
| Earnings Per Share | -$0.57 | $5.08 | $5.46 | $6.02 | $3.26 | $6.47 |
| EPS Growth | n/a | 991.23% | 7.48% | 10.26% | -45.85% | 98.47% |
| Avg. Price | $61.67 | $55.04 | $59.5 | $79.03 | $97.97 | $71.01 |
| P/E Ratio | -108.19 | 10.79 | 10.86 | 13.02 | 29.78 | 10.94 |
| Free Cash Flow (M) | $6,828 | $10,391 | $13,428 | $15,745 | $13,450 | $10,395 |
| CAPEX (M) | $2,037 | $2,457 | $2,437 | $2,520 | $2,727 | $3,031 |
| EV / EBITDA | 19.77 | 8.2 | 7.32 | 8.45 | 13.79 | 7.97 |
| Total Debt (M) | $74,694 | $68,480 | $64,647 | $56,176 | $52,254 | $61,410 |
| Net Debt / EBITDA | 10.48 | 3.84 | 3.09 | 2.63 | 3.23 | 2.94 |
| Current Ratio | 1.03 | 0.94 | 0.91 | 0.89 | 0.95 | 0.86 |
CVS Health has growing revenues and increasing reinvestment in the business and exceptional EPS growth. Additionally, the company's financial statements display decent operating margins with a stable trend and generally positive cash flows. However, the firm has not enough current assets to cover current liabilities because its current ratio is 0.86. Finally, we note that CVS Health has significant leverage levels.
CVS Health Has Attractive Multiples and Trades Below Its Fair Value:
CVS Health has a trailing twelve month P/E ratio of 11.7, compared to an average of 21.21 for the Consumer Staples sector. Based on its EPS guidance of $9.18, the company has a forward P/E ratio of 8.3. According to the 50.0% compound average growth rate of CVS Health's historical and projected earnings per share, the company's PEG ratio is 0.23. Taking the weighted average of the company's EPS CAGR and the broader market's 5-year projected EPS growth rate, we obtain a normalized growth rate of 21.2%. On this basis, the company's PEG ratio is 0.55. This suggests that its shares are undervalued. Additionally, the market is possibly undervaluing CVS Health in terms of its equity because its P/B ratio is 1.2 whereas the sector average is 4.12. The company's shares are currently trading -23.4% above their Graham number.
CVS Health Has an Analyst Consensus of Some Upside Potential:
The 24 analysts following CVS Health have set target prices ranging from $74.0 to $99.0 per share, for an average of $87.3 with a buy rating. The company is trading -18.5% away from its average target price, indicating that there is an analyst consensus of some upside potential.
CVS Health has a very low short interest because 1.8% of the company's shares are sold short. Institutions own 82.9% of the company's shares, and the insider ownership rate stands at 0.12%, suggesting a small amount of insider investors. The largest shareholder is Vanguard Group Inc, whose 9% stake in the company is worth $8,378,798,816.