Now trading at a price of $275.86, Arista Networks has moved -7.0% so far today.
Arista Networks returned gains of 81.3% last year, with its stock price reaching a high of $307.74 and a low of $131.68. Over the same period, the stock outperformed the S&P 500 index by 55.6%. More recently, the company's 50-day average price was $281.18. Arista Networks, Inc. engages in the development, marketing, and sale of data-driven, client to cloud networking solutions for data center, campus, and routing environments in the Americas, Europe, the Middle East, Africa, and the Asia-Pacific. Based in Santa Clara, CA, the Large-Cap Technology company has 4,023 full time employees. Arista Networks has not offered a dividend during the last year.
Wider Gross Margins Than the Industry Average of 36.39%:
| 2018 | 2019 | 2020 | 2021 | 2022 | 2023 | |
|---|---|---|---|---|---|---|
| Revenue (M) | $2,151 | $2,411 | $2,318 | $2,948 | $4,381 | $5,860 |
| Gross Margins | 64% | 64% | 64% | 64% | 61% | 62% |
| Net Margins | 15% | 36% | 27% | 28% | 31% | 36% |
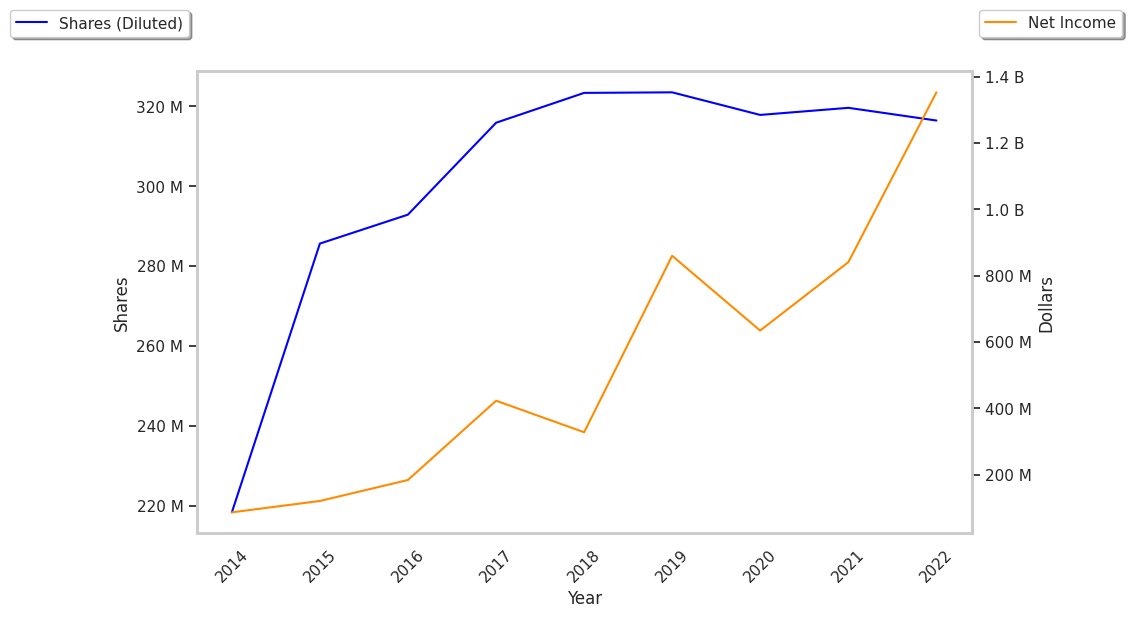
| Net Income (M) | $328 | $860 | $635 | $841 | $1,352 | $2,087 |
| Net Interest Expense (M) | $3 | $51 | $27 | $7 | $28 | $152 |
| Depreciation & Amort. (M) | $28 | $33 | $35 | $50 | $63 | $71 |
| Diluted Shares (M) | 323 | 324 | 318 | 319 | 316 | 317 |
| Earnings Per Share | $1.01 | $2.66 | $2.0 | $2.63 | $4.27 | $6.58 |
| EPS Growth | n/a | 163.37% | -24.81% | 31.5% | 62.36% | 54.1% |
| Avg. Price | $64.55 | $61.76 | $56.13 | $92.57 | $117.3 | $282.08 |
| P/E Ratio | 58.15 | 21.75 | 27.12 | 33.66 | 26.72 | 41.42 |
| Free Cash Flow (M) | $479 | $947 | $720 | $951 | $448 | $2,000 |
| CAPEX (M) | $24 | $16 | $15 | $65 | $45 | $34 |
| Current Ratio | 4.48 | 5.81 | 4.99 | 4.34 | 4.29 | 4.39 |
Arista Networks benefits from rapidly growing revenues and increasing reinvestment in the business, exceptional EPS growth, and generally positive cash flows. The company's financial statements show an excellent current ratio of 4.39 and wider gross margins than its peer group.
Earnings Expected to Improve but Trades Above Its Graham Number:
Arista Networks has a trailing twelve month P/E ratio of 42.7, compared to an average of 35.0 for the Technology sector. Based on its EPS guidance of $8.59, the company has a forward P/E ratio of 32.7. According to the 35.8% compound average growth rate of Arista Networks's historical and projected earnings per share, the company's PEG ratio is 1.19. Taking the weighted average of the company's EPS CAGR and the broader market's 5-year projected EPS growth rate, we obtain a normalized growth rate of 18.2%. On this basis, the company's PEG ratio is 2.35. This suggests that these shares are overvalued. Furthermore, Arista Networks is likely overvalued compared to the book value of its equity, since its P/B ratio of 11.93 is higher than the sector average of 7.92. The company's shares are currently trading 375.2% below their Graham number. Ultimately, Arista Networks's strong cash flows, decent earnings multiple, and healthy debt levels factor towards it being fairly valued, its elevated P/B ratio notwithstanding.
There's an Analyst Consensus of Some Upside Potential for Arista Networks:
The 19 analysts following Arista Networks have set target prices ranging from $223.0 to $356.0 per share, for an average of $297.91 with a buy rating. The company is trading -7.4% away from its average target price, indicating that there is an analyst consensus of some upside potential.
Arista Networks has a very low short interest because 1.3% of the company's shares are sold short. Institutions own 70.3% of the company's shares, and the insider ownership rate stands at 18.55%, suggesting a large amount of insider shareholders. The largest shareholder is Vanguard Group Inc, whose 9% stake in the company is worth $8,136,456,061.