It's been a great afternoon session for Suncor Energy investors, who saw their shares rise 1.5% to a price of $37.75 per share. At these higher prices, is the company still fairly valued? If you are thinking about investing, make sure to check the company's fundamentals before making a decision.
Suncor Energy Has Attractive P/B and P/E Ratios:
Suncor Energy Inc. operates as an integrated energy company in Canada, the United States, and internationally. The company belongs to the Energy sector, which has an average price to earnings (P/E) ratio of 8.53 and an average price to book (P/B) ratio of 1.78. In contrast, Suncor Energy has a trailing 12 month P/E ratio of 8.2 and a P/B ratio of 1.13.
When we divide Suncor Energy's P/E ratio by its expected EPS growth rate of the next five years, we obtain its PEG ratio of -2.39. Since it's negative, the company has negative growth expectations, and most investors will probably avoid the stock unless it has an exceptionally low P/E and P/B ratio.
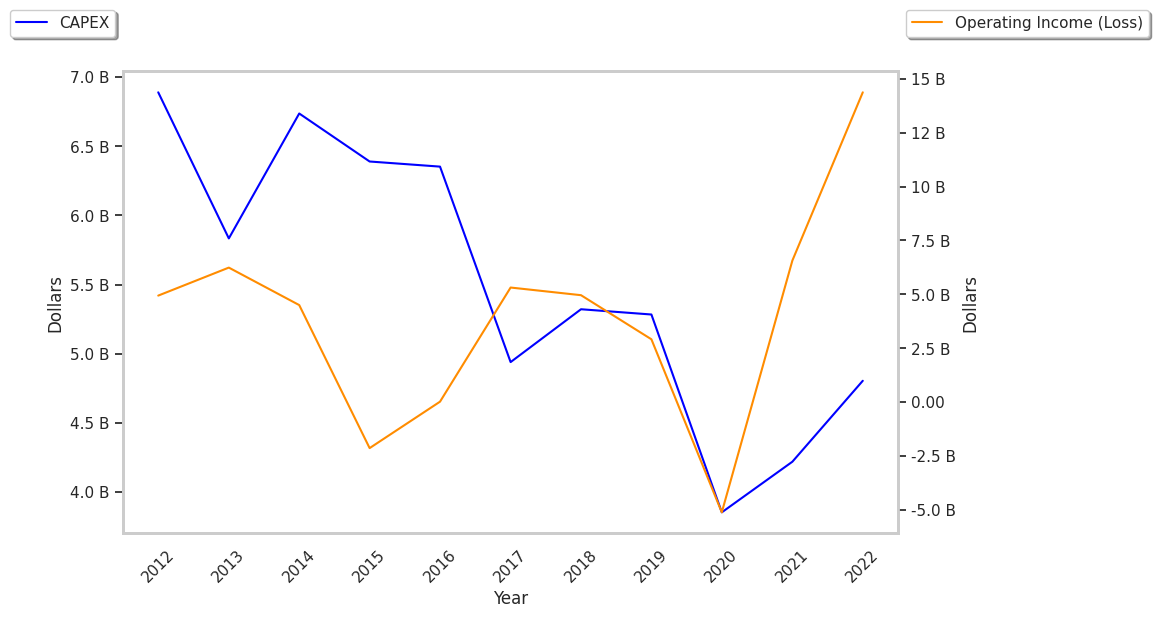
Generally Positive Cash Flows but an Average Current Ratio:
| 2017 | 2018 | 2019 | 2020 | 2021 | 2022 | |
|---|---|---|---|---|---|---|
| Revenue (M) | $32,176 | $38,986 | $38,989 | $25,052 | $39,101 | $58,467 |
| Net Margins | 14% | 8% | 7% | -17% | 11% | 16% |
| Net Income (M) | $4,458 | $3,293 | $2,899 | -$4,319 | $4,119 | $9,077 |
| Net Interest Expense (M) | $216 | $741 | $875 | $930 | $851 | $814 |
| Depreciation & Amort. (M) | $5,601 | $5,738 | $10,572 | $9,526 | $5,850 | $8,786 |
| Earnings Per Share | $2.68 | $2.02 | $1.86 | -$2.83 | $2.77 | $6.53 |
| Avg. Price | $26.53 | $30.11 | $26.58 | $16.14 | $19.89 | $31.21 |
| P/E Ratio | 9.9 | 14.83 | 14.29 | -5.7 | 7.18 | 4.77 |
| Free Cash Flow (M) | $8,966 | $10,580 | $10,421 | $2,675 | $11,764 | $15,680 |
| Total Debt (M) | $13,372 | $13,890 | $12,884 | $13,812 | $13,989 | $9,800 |
| Current Ratio | 1.0 | 0.84 | 0.94 | 0.89 | 1.06 | 1.13 |