Southern shares fell by -1.6% during the day's afternoon session, and are now trading at a price of $73.21. Is it time to buy the dip? To better answer that question, it's essential to check if the market is valuing the company's shares fairly in terms of its earnings and equity levels.
Southern's Valuation Is in Line With Its Sector Averages:
The Southern Company, through its subsidiaries, engages in the generation, transmission, and distribution of electricity. The company belongs to the Utilities sector, which has an average price to earnings (P/E) ratio of 17.53 and an average price to book (P/B) ratio of 1.71. In contrast, Southern has a trailing 12 month P/E ratio of 20.2 and a P/B ratio of 2.54.
Southern's PEG ratio is 2.55, which shows that the stock is probably overvalued in terms of its estimated growth. For reference, a PEG ratio near or below 1 is a potential signal that a company is undervalued.
The Company May Be Profitable, but Its Balance Sheet Is Highly Leveraged:
| 2018 | 2019 | 2020 | 2021 | 2022 | 2023 | |
|---|---|---|---|---|---|---|
| Revenue (M) | $25,241 | $22,596 | $20,375 | $23,113 | $29,279 | $25,253 |
| Operating Margins | 17% | 34% | 24% | 16% | 18% | 23% |
| Net Margins | 9% | 21% | 15% | 10% | 12% | 15% |
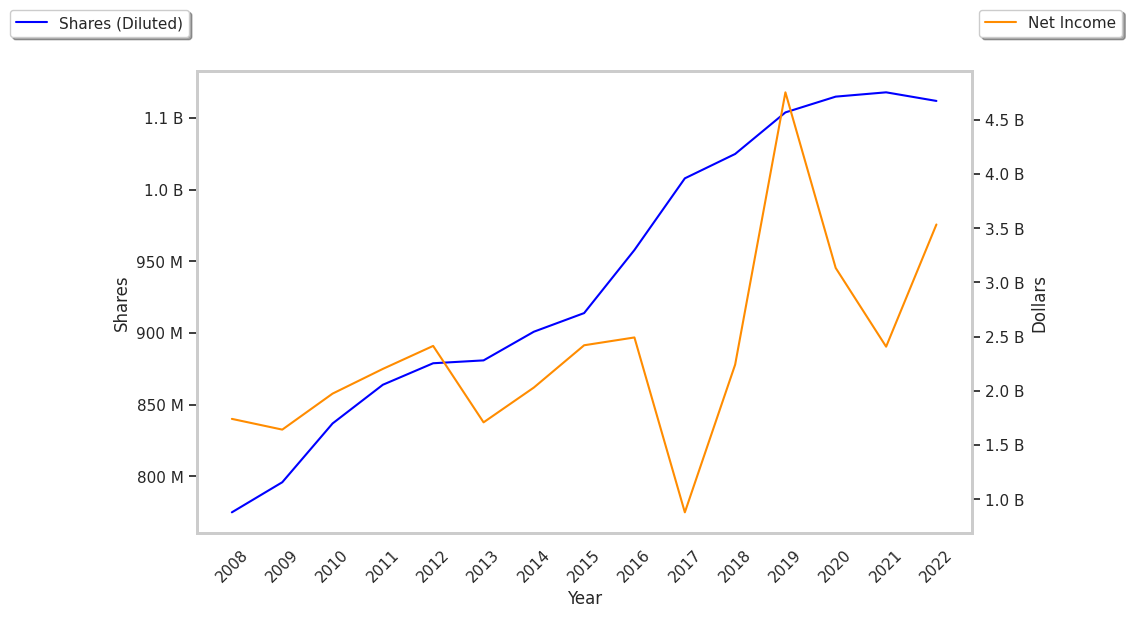
| Net Income (M) | $2,300 | $4,744 | $3,103 | $2,309 | $3,428 | $3,849 |
| Net Interest Expense (M) | $1,842 | $1,736 | $1,821 | $1,837 | $2,022 | $2,446 |
| Depreciation & Amort. (M) | $3,549 | $3,331 | $3,905 | $3,973 | $4,064 | $4,986 |
| Diluted Shares (M) | 1,025 | 1,054 | 1,065 | 1,068 | 1,081 | 1,098 |
| Earnings Per Share | $2.17 | $4.5 | $2.93 | $2.24 | $3.26 | $3.62 |
| EPS Growth | n/a | 107.37% | -34.89% | -23.55% | 45.54% | 11.04% |
| Avg. Price | $36.52 | $47.37 | $51.47 | $58.3 | $67.33 | $73.21 |
| P/E Ratio | 16.75 | 10.46 | 17.45 | 25.8 | 20.53 | 20.11 |
| Free Cash Flow (M) | -$1,056 | -$1,774 | -$826 | -$1,417 | -$1,621 | -$1,542 |
| CAPEX (M) | $8,001 | $7,555 | $7,522 | $7,586 | $7,923 | $9,095 |
| EV / EBITDA | 10.07 | 8.2 | 11.42 | 14.64 | 13.03 | 12.87 |
| Total Debt (M) | $40,736 | $41,798 | $45,073 | $50,120 | $50,656 | $57,210 |
| Net Debt / EBITDA | 5.08 | 3.6 | 5.01 | 6.3 | 5.17 | 5.22 |
| Current Ratio | 0.67 | 0.78 | 0.71 | 0.82 | 0.66 | 0.77 |
Southern has slight revenue growth and increasing reinvestment in the business, strong operating margins with a stable trend, and positive EPS growth. However, Southern has negative cash flows, not enough current assets to cover current liabilities because its current ratio is 0.77, and a highly leveraged balance sheet.