Medical Specialities company Exact Sciences is taking Wall Street by surprise today, falling to $50.07 and marking a -7.4% change compared to the S&P 500, which moved 1.0%. EXAS is -42.26% below its average analyst target price of $86.71, which implies there is more upside for the stock.
As such, the average analyst rates it at buy. Over the last year, Exact Sciences has underperfomed the S&P 500 by -59.3%, moving -34.1%.
Exact Sciences Corporation provides cancer screening and diagnostic test products in the United States and internationally. The company is part of the healthcare sector. Healthcare companies work in incredibly complex markets, and their valuations can change in an instant based on a denied drug approval, a research and development breakthrough at a competitor, or a new government regulation. In the longer term, healthcare companies are affected by factors as varied as demographics and epidemiology. Investors who want to understand the healthcare market should be prepared for deep dives into a wide range of topics.
Exact Sciences does not publish either its forward or trailing P/E ratios because their values are negative -- meaning that each share of stock represents a net earnings loss. But we can calculate these P/E ratios anyways using the stocks forward and trailing (EPS) values of $-0.08 and $-1.31. We can see that EXAS has a forward P/E ratio of -625.9 and a trailing P/E ratio of -38.2. The P/E ratio is the company's share price divided by its earnings per share. In other words, it represents how much investors are willing to spend for each dollar of the company's earnings (revenues minus the cost of goods sold, taxes, and overhead). As of the first quarter of 2023, the health care sector has an average P/E ratio of 30.21, and the average for the S&P 500 is 15.97.
One limitation P/E ratios is that they don't tell us to what extent future growth expectations are priced into Exact Sciences market valuation. For example, a company with a low P/E ratio may not actually be a good value if it has little growth potential. On the other hand, it's possible for companies with high P/E ratios to be fairly valued in terms of their growth expectations.
Dividing Exact Sciences's P/E ratio by its projected 5 year earnings growth rate gives us its Price to Earnings Growth (PEG) ratio of -0.48. Since it's negative, either the company's current P/E ratio or its growth rate is negative -- neither of which is a good sign.
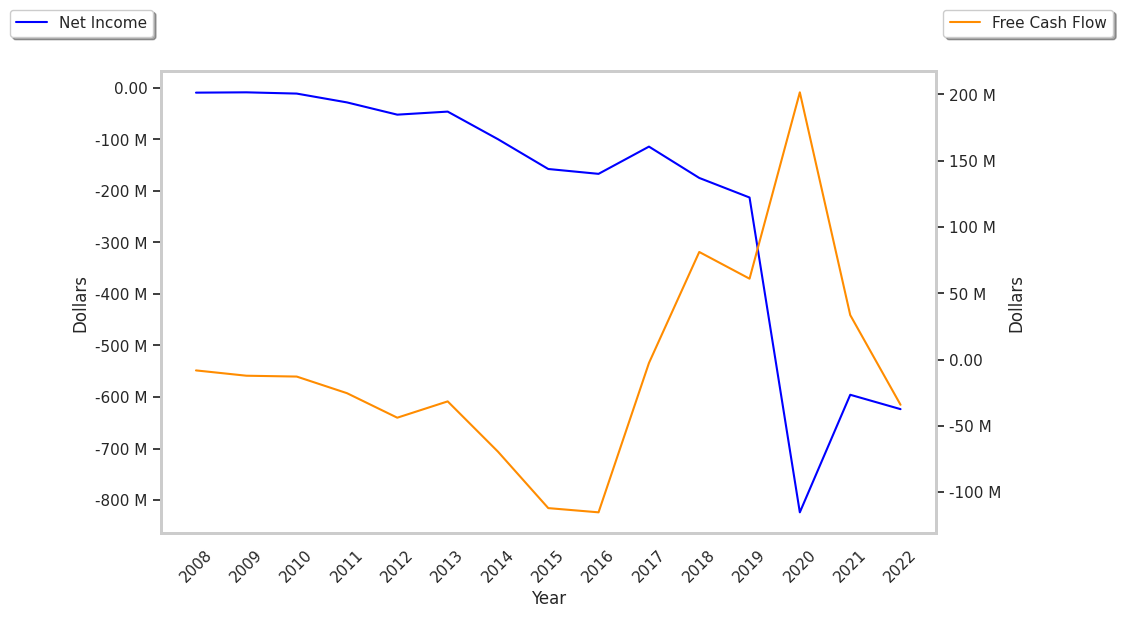
When we subtract capital expenditures from operating cash flows, we are left with the company's free cash flow, which for Exact Sciences was $31.93 Million as of its last annual report. Free cash flow represents the amount of money available for reinvestment in the business or for payments to equity investors in the form of a dividend. In EXAS's case the cash flow outlook is weak. It's average cash flow over the last 4 years has been $-179338666.7 and they've been growing at an average rate of 2.4%.
Another valuation metric for analyzing a stock is its Price to Book (P/B) Ratio, which consists in its share price divided by its book value per share. The book value refers to the present liquidation value of the company, as if it sold all of its assets and paid off all debts). Exact sciences's P/B ratio indicates that the market value of the company exceeds its book value by a factor of 2.94, but is still below the average P/B ratio of the Health Care sector, which stood at 4.08 as of the first quarter of 2023.
Since it has a negative P/E ratio., a lower P/B ratio than its sector average, and negative cash flows with a flat trend, Exact Sciences is likely overvalued at today's prices. The company has poor growth indicators because of no PEG ratio and weak operating margins with a positive growth rate. We hope you enjoyed this overview of EXAS's fundamentals. Be sure to check the numbers for yourself, especially focusing on their trends over the last few years.