Now trading at a price of $89.73, American Electric Power has moved -0.7% so far today.
American Electric Power returned gains of 6.9% last year, with its stock price reaching a high of $93.44 and a low of $69.38. Over the same period, the stock underperformed the S&P 500 index by -17.1%. The company's 50-day average price was $87.04. American Electric Power Company, Inc., an electric public utility holding company, engages in the generation, transmission, and distribution of electricity for sale to retail and wholesale customers in the United States. Based in Columbus, OH, the Large-Cap Utilities company has 16,800 full time employees. American Electric Power has returned a 3.8% dividend yield over the last 12 months, but this may not be sustainable seen that the company has a choppy cash flow record.
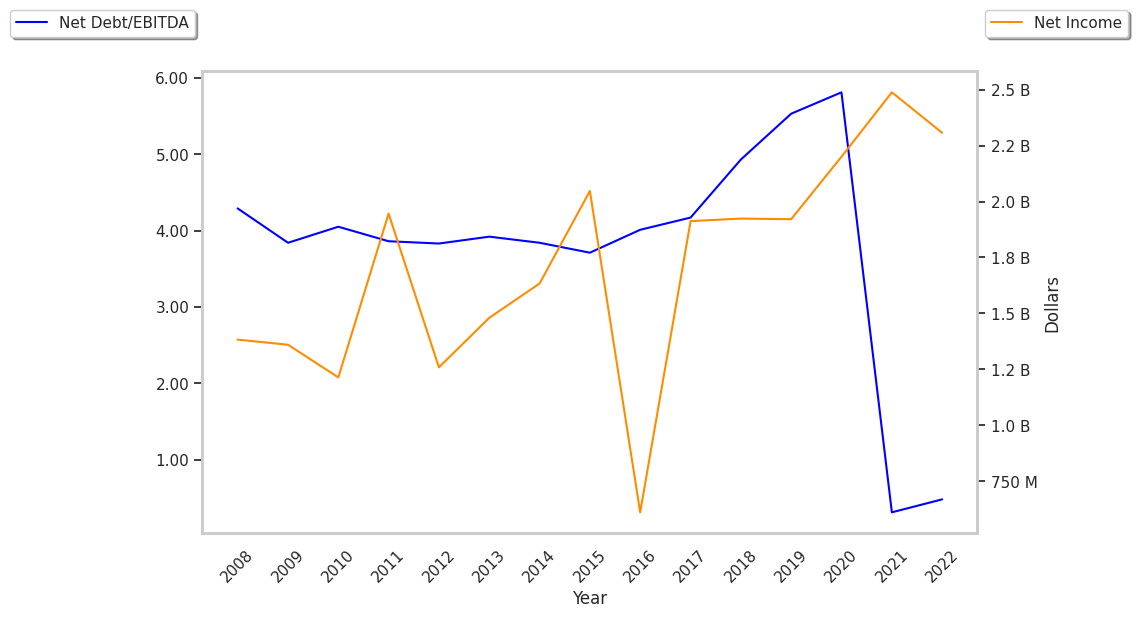
The Company May Be Profitable, but Its Balance Sheet Is Highly Leveraged:
| 2018 | 2019 | 2020 | 2021 | 2022 | 2023 | |
|---|---|---|---|---|---|---|
| Revenue (M) | $16,196 | $15,561 | $14,918 | $16,792 | $19,640 | $18,982 |
| Operating Margins | 17% | 17% | 20% | 20% | 18% | 19% |
| Net Margins | 12% | 12% | 15% | 15% | 12% | 12% |
| Net Income (M) | $1,931 | $1,920 | $2,197 | $2,488 | $2,306 | $2,213 |
| Net Interest Expense (M) | $984 | $1,072 | $1,166 | $1,199 | $1,396 | $1,807 |
| Depreciation & Amort. (M) | $2,287 | $2,514 | $2,683 | $2,826 | $3,203 | $3,090 |
| Diluted Shares (M) | 494 | 495 | 497 | 502 | 513 | 520 |
| Earnings Per Share | $3.9 | $3.88 | $4.42 | $4.96 | $4.49 | $4.24 |
| EPS Growth | n/a | -0.51% | 13.92% | 12.22% | -9.48% | -5.57% |
| Avg. Price | $59.38 | $76.41 | $77.83 | $79.02 | $91.28 | $89.37 |
| P/E Ratio | 15.23 | 19.64 | 17.53 | 15.9 | 20.24 | 20.98 |
| Free Cash Flow (M) | $5,209 | $4,273 | $3,833 | -$1,820 | -$1,384 | -$2,366 |
| CAPEX (M) | $15 | $3 | n/a | $5,660 | $6,672 | $7,378 |
| EV / EBITDA | 10.55 | 12.58 | 12.23 | 11.86 | 13.06 | 13.07 |
| Total Debt (M) | $23,347 | $26,744 | $31,108 | $34,558 | $40,913 | $40,148 |
| Net Debt / EBITDA | 4.65 | 5.19 | 5.42 | 5.48 | 6.04 | 5.99 |
| Current Ratio | 0.48 | 0.4 | 0.44 | 0.46 | 0.51 | 0.53 |
American Electric Power has growing revenues and increasing reinvestment in the business, decent operating margins with a stable trend, and positive EPS growth. However, American Electric Power has positive cash flows, not enough current assets to cover current liabilities because its current ratio is 0.53, and a highly leveraged balance sheet.
a Very Low P/E Ratio but Priced Beyond Its Margin of Safety:
American Electric Power has a trailing twelve month P/E ratio of 16.2, compared to an average of 20.35 for the Utilities sector. Based on its EPS guidance of $5.98, the company has a forward P/E ratio of 14.6. The 6.3% compound average growth rate of American Electric Power's historical and projected earnings per share yields a PEG ratio of 2.57. This suggests that these shares are overvalued. In contrast, the market is likely undervaluing American Electric Power in terms of its equity because its P/B ratio is 1.83 while the sector average is 2.27. The company's shares are currently trading 31.9% below their Graham number.
There's an Analyst Consensus of Little Upside Potential for American Electric Power:
The 15 analysts following American Electric Power have set target prices ranging from $73.0 to $100.0 per share, for an average of $89.25 with a hold rating. The company is trading 0.5% away from its average target price, indicating that there is an analyst consensus of little upside potential.
American Electric Power has an average amount of shares sold short because 2.2% of the company's shares are sold short. Institutions own 79.6% of the company's shares, and the insider ownership rate stands at 0.04%, suggesting a small amount of insider investors. The largest shareholder is Vanguard Group Inc, whose 10% stake in the company is worth $4,453,339,188.