It hasn't been a great evening session for First Solar investors, who have watched their shares sink by -2.2% to a price of $267.34. Some of you might be wondering if it's time to buy the dip. If you are considering this, make sure to check the company's fundamentals first to determine if the shares are fairly valued at today's prices.
Forward Earnings Expected to Increase but Priced Beyond Its Margin of Safety:
First Solar, Inc., a solar technology company, provides photovoltaic (PV) solar energy solutions in the United States, France, Japan, Chile, and internationally. The company belongs to the Technology sector, which has an average price to earnings (P/E) ratio of 32.54 and an average price to book (P/B) ratio of 4.25. In contrast, First Solar has a trailing 12 month P/E ratio of 28.0 and a P/B ratio of 4.15.
When we divideFirst Solar's P/E ratio by its expected five-year EPS growth rate, we obtain a PEG ratio of 0.35, which indicates that the market is undervaluing the company's projected growth (a PEG ratio of 1 indicates a fairly valued company). Your analysis of the stock shouldn't end here. Rather, a good PEG ratio should alert you that it may be worthwhile to take a closer look at the stock.
Negative Cash Flows:
| 2018 | 2019 | 2020 | 2021 | 2022 | 2023 | |
|---|---|---|---|---|---|---|
| Revenue (M) | $2,244 | $3,063 | $2,711 | $2,923 | $2,619 | $3,319 |
| Gross Margins | 17% | 18% | 25% | 25% | 3% | 39% |
| Net Margins | 6% | -4% | 15% | 16% | -2% | 25% |
| Net Income (M) | $144 | -$115 | $398 | $469 | -$44 | $831 |
| Net Interest Expense (M) | $26 | $27 | $24 | $13 | $12 | $13 |
| Depreciation & Amort. (M) | $131 | $205 | $233 | $260 | $270 | $308 |
| Diluted Shares (M) | 106 | 105 | 107 | 107 | 107 | 107 |
| Earnings Per Share | $1.36 | -$1.09 | $3.73 | $4.38 | -$0.41 | $7.74 |
| EPS Growth | n/a | -180.15% | 442.2% | 17.43% | -109.36% | 1987.8% |
| Avg. Price | $57.26 | $57.45 | $61.49 | $91.68 | $73.68 | $267.34 |
| P/E Ratio | 41.49 | -52.71 | 16.35 | 20.79 | -179.71 | 34.36 |
| Free Cash Flow (M) | -$1,067 | -$495 | -$380 | -$303 | -$30 | -$785 |
| CAPEX (M) | $740 | $669 | $417 | $540 | $904 | $1,387 |
| EV / EBITDA | 29.53 | 117.76 | 10.15 | 10.06 | 26.96 | 23.25 |
| Total Debt (M) | $467 | $472 | $329 | $251 | $185 | $534 |
| Net Debt / EBITDA | -5.48 | -20.17 | -1.63 | -1.42 | -5.35 | -1.21 |
| Current Ratio | 4.57 | 2.73 | 3.56 | 4.39 | 3.65 | 3.55 |
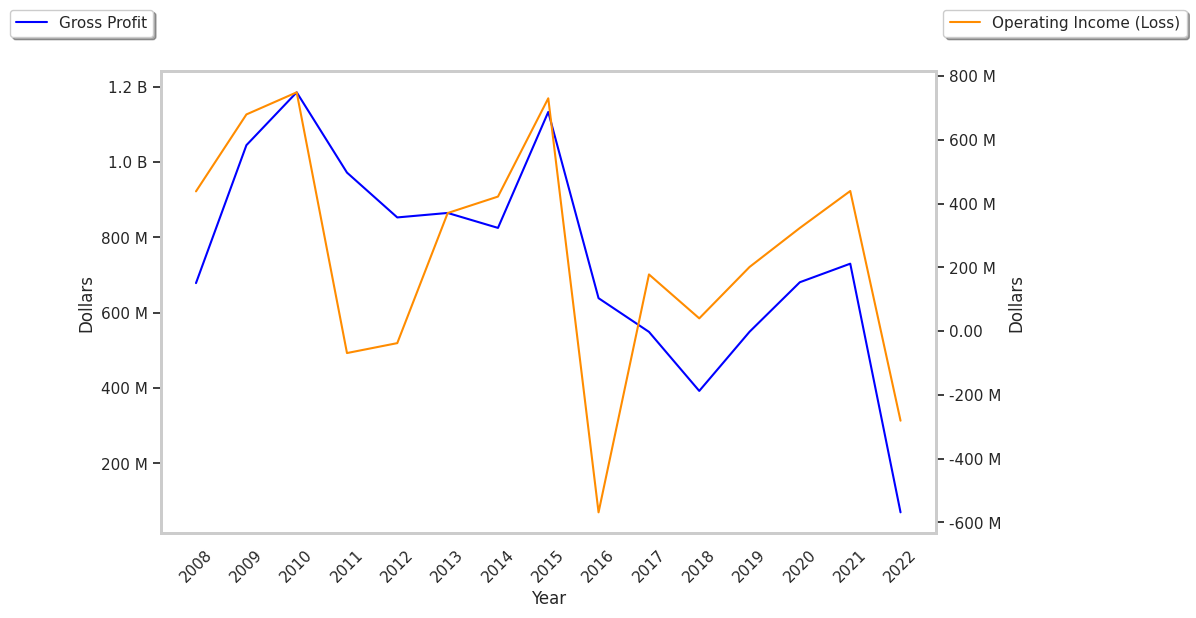
First Solar has growing revenues and increasing reinvestment in the business and exceptional EPS growth. Additionally, the company's financial statements display an excellent current ratio of 3.55 and healthy leverage levels. However, the firm suffers from slimmer gross margins than its peers and negative cash flows.