Now trading at a price of $66.71, Equity Residential has moved 1.1% so far today.
Over the last year, Equity Residential logged a -1.1% change, with its stock price reaching a high of $69.45 and a low of $52.57. Over the same period, the stock underperformed the S&P 500 index by -24.4%. AThe company's 50-day average price was $64.7. Equity Residential is committed to creating communities where people thrive. Based in Chicago, IL, the Large-Cap Real Estate company has 2,400 full time employees. Equity Residential has offered a 4.0% dividend yield over the last 12 months.
The Company's Revenues Are Declining:
| 2018 | 2019 | 2020 | 2021 | 2022 | 2023 | |
|---|---|---|---|---|---|---|
| Revenue (k) | $2,578,434 | $2,701,075 | $531,807 | $1,072,183 | $304,325 | $282,539 |
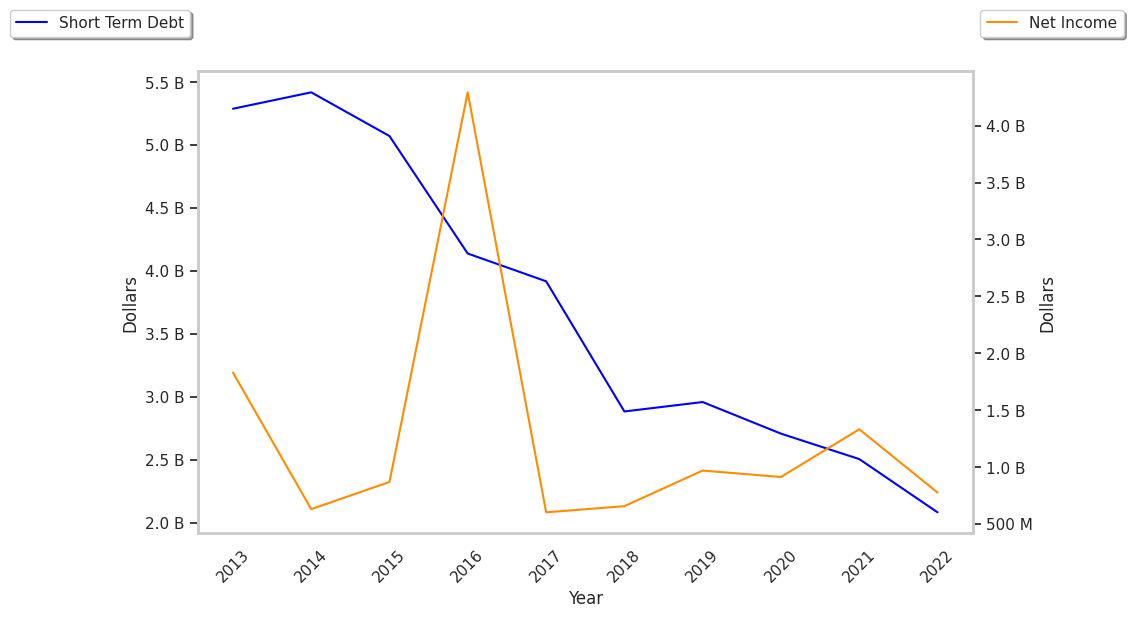
| Net Income (k) | $685,192 | $1,009,708 | $962,501 | $1,396,714 | $806,995 | $868,488 |
| Net Interest Expense (k) | $413,360 | $390,076 | $365,073 | $272,473 | $282,920 | $269,556 |
| Depreciation & Amort. (k) | $785,725 | $831,083 | $820,832 | $838,272 | $882,168 | $888,709 |
| Diluted Shares (k) | 383,695 | 386,333 | 385,874 | 388,089 | 389,450 | 390,897 |
| Earnings Per Share | $1.77 | $2.6 | $2.45 | $3.54 | $2.05 | $2.2 |
| EPS Growth | n/a | 46.89% | -5.77% | 44.49% | -42.09% | 7.32% |
| Avg. Price | $53.35 | $68.14 | $55.87 | $72.18 | $79.03 | $66.71 |
| P/E Ratio | 29.97 | 26.11 | 22.8 | 20.28 | 38.36 | 30.32 |
| Free Cash Flow (k) | $1,167,794 | $1,261,292 | $1,035,204 | $1,053,763 | $1,345,411 | $1,454,601 |
| CAPEX (k) | $188,501 | $195,692 | $230,332 | $206,421 | $109,345 | $78,197 |
| EV / EBITDA | 15.0 | 15.68 | 13.5 | 14.0 | 18.59 | 15.94 |
| Total Debt (k) | $8,912,761 | $9,130,979 | $8,126,903 | $8,421,172 | $7,494,250 | $7,464,657 |
| Net Debt / EBITDA | 4.67 | 4.15 | 3.78 | 3.3 | 3.72 | 3.62 |
Equity Residential's Valuation Is in Line With Its Sector Averages:
Equity Residential has a trailing twelve month P/E ratio of 27.6, compared to an average of 27.5 for the Real Estate sector. Based on its EPS guidance of $1.67, the company has a forward P/E ratio of 38.7. The -0.8% compound average growth rate of Equity Residential's historical and projected earnings per share yields a PEG ratio of -33.42. This indicates that its shares are overvalued.The market is placing a fair value on Equity Residential's equity, since its P/B ratio of 2.29 is comparable to its sector average of 2.1. The company's shares are currently trading 78.0% below their Graham number. In conclusion, Equity Residential's impressive cash flow trend, decent P/B ratio, and reasonable use of leverage demonstrate that the company may still be fairly valued — despite its elevated earnings multiple.
Equity Residential Has an Average Rating of Hold:
The 19 analysts following Equity Residential have set target prices ranging from $62.0 to $75.0 per share, for an average of $68.37 with a hold rating. The company is trading -2.4% away from its average target price, indicating that there is an analyst consensus of some upside potential.
Equity Residential has a very low short interest because 1.6% of the company's shares are sold short. Institutions own 96.3% of the company's shares, and the insider ownership rate stands at 0.51%, suggesting a small amount of insider investors. The largest shareholder is Vanguard Group Inc, whose 15% stake in the company is worth $3,801,967,754.