Now trading at a price of $38.75, Corning has moved 4.0% so far today.
Corning returned gains of 6.7% last year, with its stock price reaching a high of $39.15 and a low of $25.26. Over the same period, the stock underperformed the S&P 500 index by -17.0%. The company's 50-day average price was $34.32. Corning Incorporated engages in the display technologies, optical communications, environmental technologies, specialty materials, and life sciences businesses in the United States and internationally. Based in Corning, NY, the Large-Cap Industrials company has 49,800 full time employees. Corning has offered a 3.0% dividend yield over the last 12 months.
The Company's Revenues Are Declining:
| 2018 | 2019 | 2020 | 2021 | 2022 | 2023 | |
|---|---|---|---|---|---|---|
| Revenue (M) | $11,290 | $11,503 | $11,303 | $14,082 | $14,189 | $12,588 |
| Gross Margins | 40% | 35% | 31% | 36% | 32% | 31% |
| Net Margins | 9% | 8% | 5% | 14% | 9% | 5% |
| Net Income (M) | $1,066 | $960 | $512 | $1,906 | $1,316 | $581 |
| Net Interest Expense (M) | $191 | $221 | $276 | $300 | $292 | $329 |
| Depreciation & Amort. (M) | $1,199 | $1,390 | $1,399 | $129 | $123 | $122 |
| Diluted Shares (M) | 941 | 899 | 772 | 844 | 857 | 859 |
| Earnings Per Share | $1.13 | $1.07 | $0.54 | $1.28 | $1.54 | $0.68 |
| EPS Growth | n/a | -5.31% | -49.53% | 137.04% | 20.31% | -55.84% |
| Avg. Price | $26.65 | $27.5 | $26.49 | $37.55 | $35.09 | $38.75 |
| P/E Ratio | 22.39 | 24.77 | 49.06 | 28.88 | 22.49 | 56.16 |
| Free Cash Flow (M) | $677 | $53 | $803 | $1,775 | $1,011 | $615 |
| CAPEX (M) | $2,242 | $1,978 | $1,377 | $1,637 | $1,604 | $1,390 |
| EV / EBITDA | 9.55 | 9.99 | 13.38 | 15.06 | 22.37 | 38.09 |
| Total Debt (M) | $5,998 | $7,740 | $7,972 | $7,044 | $6,911 | $7,526 |
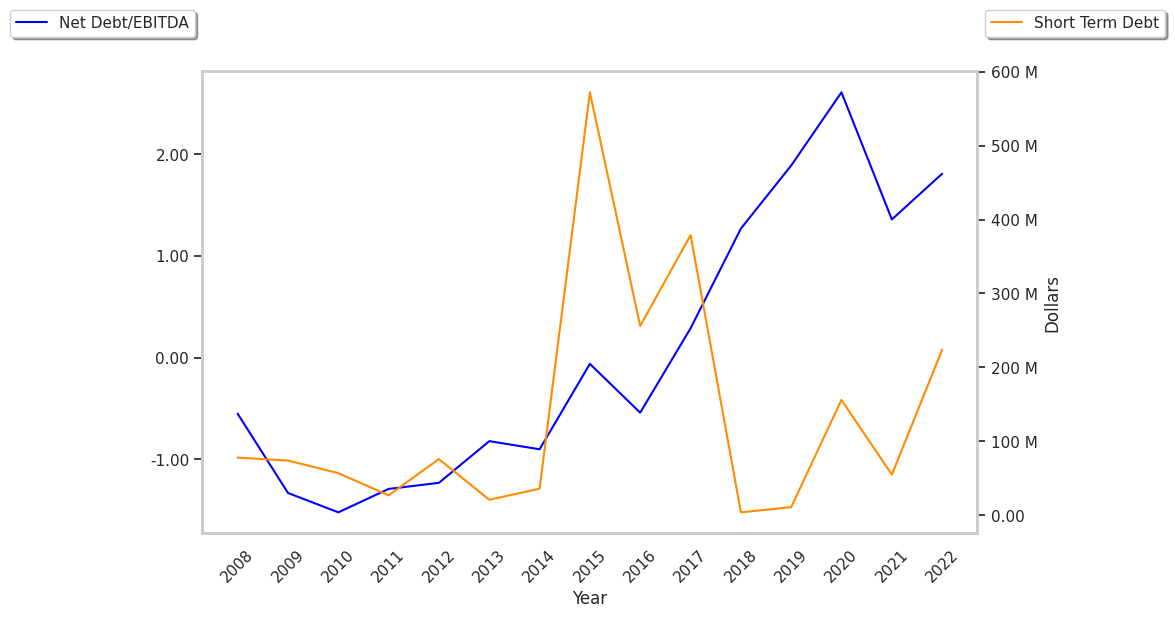
| Net Debt / EBITDA | 1.31 | 1.97 | 2.78 | 2.18 | 3.36 | 5.68 |
| Current Ratio | 2.12 | 2.12 | 2.12 | 1.59 | 1.44 | 1.67 |
Corning's financial statements include several red flags such as slight revenue growth and decreasing reinvestment in the business, slimmer gross margins than its peers, and declining EPS growth. Additionally, the firm has a highly leveraged balance sheet. On the other hand, the company benefits from generally positive cash flows and a decent current ratio of 1.67.
Corning's Valuation Is in Line With Its Sector Averages:
Corning has a trailing twelve month P/E ratio of 47.7, compared to an average of 25.4 for the Industrials sector. Based on its EPS guidance of $2.2, the company has a forward P/E ratio of 15.6. The 10.0% compound average growth rate of Corning's historical and projected earnings per share yields a PEG ratio of 4.77. This suggests that these shares are overvalued. In contrast, the market is likely undervaluing Corning in terms of its equity because its P/B ratio is 2.83 while the sector average is 3.23. The company's shares are currently trading 170.2% below their Graham number.
Corning Has an Average Rating of Buy:
The 12 analysts following Corning have set target prices ranging from $29.0 to $42.0 per share, for an average of $36.79 with a buy rating. The company is trading 5.3% away from its average target price, indicating that there is an analyst consensus of little upside potential.
Corning has a very low short interest because 1.6% of the company's shares are sold short. Institutions own 72.1% of the company's shares, and the insider ownership rate stands at 9.66%, suggesting a large amount of insider shareholders. The largest shareholder is Vanguard Group Inc, whose 11% stake in the company is worth $3,776,150,338.