Now trading at a price of $68.14, Cognizant Technology Solutions has moved 3.5% so far today.
Cognizant Technology Solutions returned gains of 5.1% last year, with its stock price reaching a high of $80.09 and a low of $61.23. Over the same period, the stock underperformed the S&P 500 index by -20.1%. The company's 50-day average price was $67.28. Cognizant Technology Solutions Corporation, a professional services company, provides consulting and technology, and outsourcing services in North America, Europe, and internationally. Based in Teaneck, NJ, the Large-Cap Technology company has 344,400 full time employees. Cognizant Technology Solutions has offered a 1.8% dividend yield over the last 12 months.
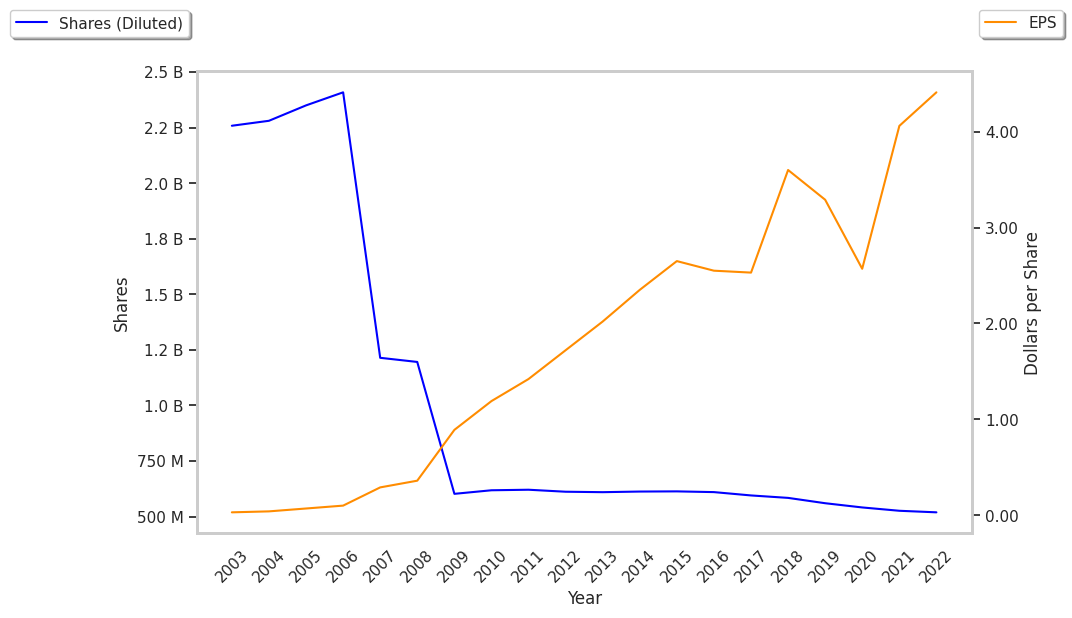
EPS Trend Sustained Primarily by Reducing the Number of Shares Outstanding:
| 2018 | 2019 | 2020 | 2021 | 2022 | 2023 | |
|---|---|---|---|---|---|---|
| Revenue (M) | $16,125 | $16,783 | $16,652 | $18,507 | $19,428 | $19,353 |
| Operating Margins | 17% | 15% | 13% | 15% | 15% | 14% |
| Net Margins | 13% | 11% | 8% | 12% | 12% | 11% |
| Net Income (M) | $2,101 | $1,842 | $1,392 | $2,137 | $2,290 | $2,126 |
| Net Interest Expense (M) | $27 | $26 | $24 | $9 | $19 | $41 |
| Depreciation & Amort. (M) | $498 | $507 | $552 | $574 | $569 | $519 |
| Diluted Shares (M) | 584 | 560 | 541 | 528 | 519 | 505 |
| Earnings Per Share | $3.6 | $3.29 | $2.57 | $4.05 | $4.41 | $4.21 |
| EPS Growth | n/a | -8.61% | -21.88% | 57.59% | 8.89% | -4.54% |
| Avg. Price | $71.28 | $61.47 | $61.0 | $74.18 | $79.93 | $68.14 |
| P/E Ratio | 19.75 | 18.63 | 23.64 | 18.27 | 18.08 | 16.19 |
| Free Cash Flow (M) | $2,215 | $2,107 | $2,901 | $2,216 | $2,236 | $2,013 |
| CAPEX (M) | $377 | $392 | $398 | $279 | $332 | $317 |
| EV / EBITDA | 12.58 | 11.3 | 11.81 | 11.24 | 11.42 | 10.2 |
| Total Debt (M) | $759 | $738 | $701 | $664 | $646 | $639 |
| Net Debt / EBITDA | -0.12 | -0.64 | -0.74 | -0.33 | -0.44 | -0.62 |
| Current Ratio | 3.18 | 2.55 | 1.94 | 2.08 | 2.17 | 2.25 |
Cognizant Technology Solutions has growing revenues and decreasing reinvestment in the business, decent operating margins with a stable trend, and positive cash flows. We also note that the company benefits from an excellent current ratio of 2.25 and healthy leverage levels. However, the firm has EPS growth achieved by reducing the number of outstanding shares.
a Lower P/B Ratio Than Its Sector Average but Trading Above Its Fair Price:
Cognizant Technology Solutions has a trailing twelve month P/E ratio of 16.1, compared to an average of 32.54 for the Technology sector. Based on its EPS guidance of $4.97, the company has a forward P/E ratio of 13.5. The 4.7% compound average growth rate of Cognizant Technology Solutions's historical and projected earnings per share yields a PEG ratio of 3.42. This suggests that these shares are overvalued. In contrast, the market is likely undervaluing Cognizant Technology Solutions in terms of its equity because its P/B ratio is 2.51 while the sector average is 4.25. The company's shares are currently trading 36.8% below their Graham number.
Cognizant Technology Solutions Has an Analyst Consensus of Some Upside Potential:
The 21 analysts following Cognizant Technology Solutions have set target prices ranging from $65.0 to $92.0 per share, for an average of $76.24 with a hold rating. The company is trading -10.6% away from its average target price, indicating that there is an analyst consensus of some upside potential.
Cognizant Technology Solutions has an average amount of shares sold short because 3.5% of the company's shares are sold short. Institutions own 98.6% of the company's shares, and the insider ownership rate stands at 0.15%, suggesting a small amount of insider investors. The largest shareholder is Vanguard Group Inc, whose 12% stake in the company is worth $3,955,242,343.