It hasn't been a great evening session for Nucor investors, who have watched their shares sink by -2.6% to a price of $151.48. Some of you might be wondering if it's time to buy the dip. If you are considering this, make sure to check the company's fundamentals first to determine if the shares are fairly valued at today's prices.
Nucor Has Attractive Multiples and Its Shares Are Discounted:
Nucor Corporation engages in manufacture and sale of steel and steel products. The company belongs to the Industrials sector, which has an average price to earnings (P/E) ratio of 25.4 and an average price to book (P/B) ratio of 3.23. In contrast, Nucor has a trailing 12 month P/E ratio of 8.9 and a P/B ratio of 1.76.
When we divide Nucor's P/E ratio by its expected EPS growth rate of the next five years, we obtain its PEG ratio of -1.84. Since it's negative, the company has negative growth expectations, and most investors will probably avoid the stock unless it has an exceptionally low P/E and P/B ratio.
Growing Revenues and Healthy Leverage Levels:
| 2018 | 2019 | 2020 | 2021 | 2022 | 2023 | |
|---|---|---|---|---|---|---|
| Revenue (M) | $25,067 | $22,589 | $20,140 | $36,484 | $41,512 | $34,714 |
| Operating Margins | 13% | 8% | 4% | 25% | 25% | 18% |
| Net Margins | 9% | 6% | 4% | 19% | 18% | 13% |
| Net Income (M) | $2,361 | $1,271 | $721 | $6,827 | $7,607 | $4,525 |
| Net Interest Expense (M) | $161 | $157 | $167 | $163 | $219 | $246 |
| Depreciation & Amort. (M) | $631 | $649 | $702 | $735 | $827 | $931 |
| Diluted Shares (M) | 317 | 306 | 303 | 293 | 263 | 250 |
| Earnings Per Share | $7.42 | $4.14 | $2.36 | $23.16 | $28.79 | $18.0 |
| EPS Growth | n/a | -44.2% | -43.0% | 881.36% | 24.31% | -37.48% |
| Avg. Price | $55.85 | $49.95 | $42.51 | $89.84 | $125.5 | $151.25 |
| P/E Ratio | 7.51 | 12.07 | 17.94 | 3.87 | 4.35 | 8.38 |
| Free Cash Flow (M) | $1,411 | $1,332 | $1,154 | $4,609 | $8,124 | $4,898 |
| CAPEX (M) | $983 | $1,477 | $1,543 | $1,622 | $1,948 | $2,214 |
| EV / EBITDA | 5.35 | 7.42 | 10.04 | 3.02 | 3.26 | 5.34 |
| Total Debt (M) | $4,291 | $4,321 | $5,283 | $5,577 | $6,642 | $6,723 |
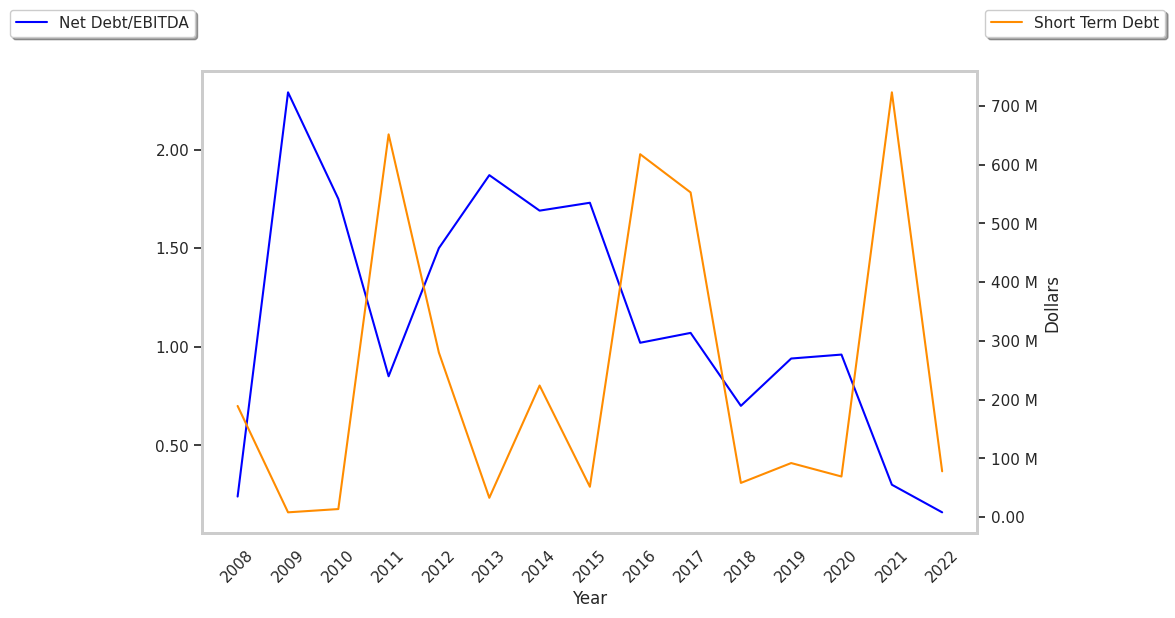
| Net Debt / EBITDA | 0.75 | 1.15 | 1.72 | 0.32 | 0.21 | 0.05 |
| Current Ratio | 3.08 | 3.34 | 3.61 | 2.48 | 3.39 | 3.57 |
Nucor has growing revenues and increasing reinvestment in the business, strong operating margins with a positive growth rate, and generally positive cash flows. The company also benefits from an excellent current ratio of 3.57, a strong EPS growth trend, and healthy leverage levels.