Sempra logged a 0.9% change during today's evening session, and is now trading at a price of $76.11 per share.
Over the last year, Sempra logged a 4.0% change, with its stock price reaching a high of $78.83 and a low of $63.75. Over the same period, the stock underperformed the S&P 500 index by -21.0%. AThe company's 50-day average price was $74.45. Sempra operates as an energy infrastructure company in the United States and internationally. Based in San Diego, CA, the Large-Cap Utilities company has 16,835 full time employees. Sempra has returned a 3.2% dividend yield over the last 12 months, but this may not be sustainable seen that the company has a choppy cash flow record.
Negative Cash Flows:
| 2018 | 2019 | 2020 | 2021 | 2022 | 2023 | |
|---|---|---|---|---|---|---|
| Revenue (M) | $10,046 | $9,448 | $10,025 | $12,857 | $14,439 | $16,720 |
| Operating Margins | 5% | 19% | 18% | 6% | 14% | 19% |
| Net Margins | 11% | 25% | 41% | 10% | 15% | 13% |
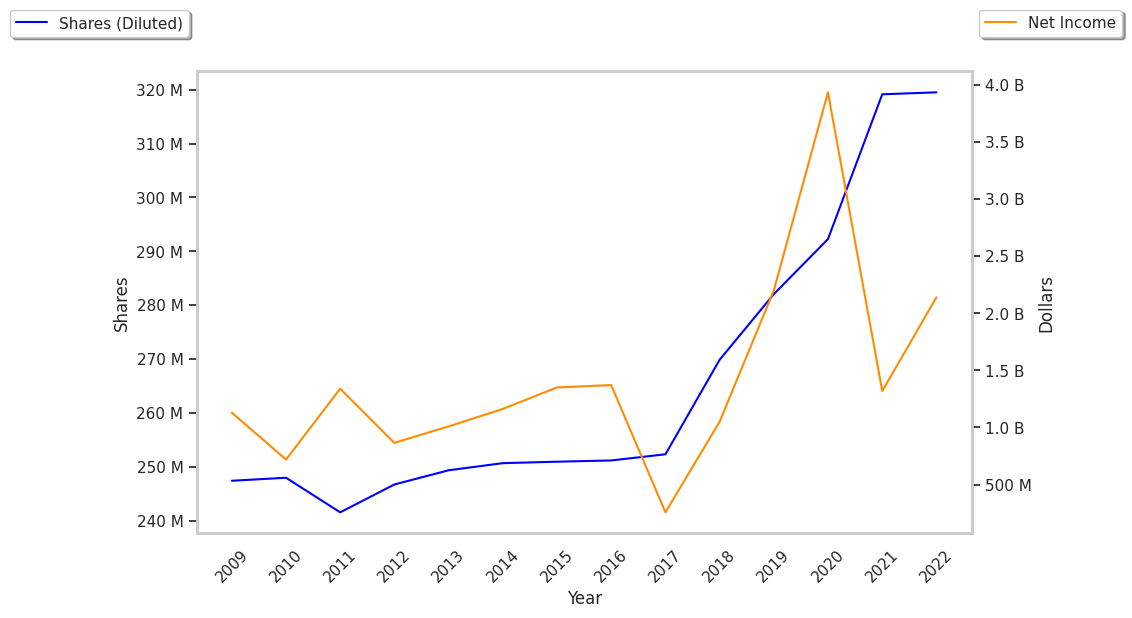
| Net Income (M) | $1,126 | $2,362 | $4,105 | $1,318 | $2,139 | $2,095 |
| Net Interest Expense (M) | $886 | $1,077 | $1,081 | $1,198 | $1,054 | $1,309 |
| Depreciation & Amort. (M) | $1,491 | $1,569 | $1,666 | $1,855 | $2,019 | $2,227 |
| Diluted Shares (M) | 593 | 578 | 580 | 626 | 633 | 633 |
| Earnings Per Share | $1.9 | $4.09 | $7.07 | $2.11 | $3.38 | $3.31 |
| EPS Growth | n/a | 115.26% | 72.86% | -70.16% | 60.19% | -2.07% |
| Avg. Price | $95.03 | $117.68 | $116.76 | $121.77 | $145.9 | $76.2 |
| P/E Ratio | 43.0 | 27.3 | 16.63 | 55.86 | 43.04 | 22.88 |
| Free Cash Flow (M) | -$28 | -$620 | -$2,085 | -$1,173 | -$4,215 | -$2,179 |
| CAPEX (M) | $3,544 | $3,708 | $4,676 | $5,015 | $5,357 | $8,397 |
| EV / EBITDA | 35.21 | 25.56 | 25.83 | 35.08 | 29.12 | 13.93 |
| Total Debt (M) | $20,906 | $20,791 | $21,791 | $21,174 | $25,567 | $28,734 |
| Net Debt / EBITDA | 10.57 | 6.21 | 6.04 | 7.67 | 6.26 | 5.19 |
| Current Ratio | 0.48 | 0.36 | 0.66 | 0.44 | 0.6 | 0.54 |
Sempra has negative cash flows, not enough current assets to cover current liabilities because its current ratio is 0.54, and a highly leveraged balance sheet. On the other hand, the company benefits from rapidly growing revenues and increasing reinvestment in the business and positive EPS growth. Furthermore, Sempra has weak operating margins with a positive growth rate.
a Lower P/B Ratio Than Its Sector Average but Trades Above Its Graham Number:
Sempra has a trailing twelve month P/E ratio of 16.5, compared to an average of 20.35 for the Utilities sector. Based on its EPS guidance of $5.16, the company has a forward P/E ratio of 14.4. According to the 15.3% compound average growth rate of Sempra's historical and projected earnings per share, the company's PEG ratio is 1.07. Taking the weighted average of the company's EPS CAGR and the broader market's 5-year projected EPS growth rate, we obtain a normalized growth rate of 11.8%. On this basis, the company's PEG ratio is 1.39. This implies that the shares are fairly valued. Additionally, the market is possibly undervaluing Sempra in terms of its equity because its P/B ratio is 1.7 whereas the sector average is 2.27. The company's shares are currently trading 31.0% below their Graham number.
Sempra Has an Average Rating of Buy:
The 15 analysts following Sempra have set target prices ranging from $76.0 to $89.0 per share, for an average of $83.86 with a buy rating. The company is trading -9.2% away from its average target price, indicating that there is an analyst consensus of some upside potential.
Sempra has an average amount of shares sold short because 2.1% of the company's shares are sold short. Institutions own 90.6% of the company's shares, and the insider ownership rate stands at 0.04%, suggesting a small amount of insider investors. The largest shareholder is Blackrock Inc., whose 10% stake in the company is worth $4,882,701,993.