Bristol-Myers Squibb may be undervalued with mixed growth prospects, but the 21 analysts following the company give it an rating of hold. Their target prices range from $37.0 to $75.0 per share, for an average of $52.25. At today's price of $41.51, Bristol-Myers Squibb is trading -20.56% away from its average target price, suggesting there is an analyst consensus of strong upside potential for the stock.
Bristol-Myers Squibb Company discovers, develops, licenses, manufactures, markets, distributes, and sells biopharmaceutical products worldwide. Based in Princeton, NJ, the Large-Cap Health Care company has 34,100 full time employees. Bristol-Myers Squibb has provided a 5.5% dividend yield over the last 12 months.
Since Bristol-Myers Squibb has negative earnings per share, its P/E ratio is not meaningful. Based on its positive EPS guidance of 6.93, however, the company has a forward P/E ratio of 6.0. The average P/E ratio for the Health Care sector is 27.53.
Bristol-Myers Squibb is also overpriced compared to its book value, since its P/B ratio of 5.1 is higher than the sector average of 3.61. The company's shares are currently 18.4% below their Graham number, indicating that its shares have a margin of safety.
| 2018 | 2019 | 2020 | 2021 | 2022 | 2023 | |
|---|---|---|---|---|---|---|
| Revenue (M) | $22,561 | $26,145 | $42,518 | $46,385 | $46,159 | $45,006 |
| Operating Margins | 26% | 19% | -16% | 17% | 17% | 19% |
| Net Margins | 22% | 13% | -21% | 15% | 14% | 18% |
| Net Income (M) | $4,920 | $3,439 | -$9,015 | $6,994 | $6,327 | $8,025 |
| Net Interest Expense (M) | $183 | $656 | $1,420 | $1,334 | $1,232 | $1,166 |
| Depreciation & Amort. (M) | $637 | $1,746 | $10,380 | $10,686 | $10,276 | $9,760 |
| Diluted Shares (M) | 1,637 | 1,712 | 2,258 | 2,245 | 2,146 | 2,078 |
| Earnings Per Share | $3.01 | $2.01 | -$3.99 | $3.12 | $2.95 | $3.86 |
| EPS Growth | n/a | -33.22% | -298.51% | 178.2% | -5.45% | 30.85% |
| Avg. Price | $49.12 | $44.09 | $54.98 | $58.88 | $68.82 | $41.51 |
| P/E Ratio | 16.32 | 21.83 | -13.78 | 18.69 | 23.17 | 10.7 |
| Free Cash Flow (M) | $6,115 | $7,374 | $13,299 | $15,234 | $11,948 | $12,651 |
| CAPEX (M) | $951 | $836 | $753 | $973 | $1,118 | $1,209 |
| EV / EBITDA | 12.4 | 16.24 | 46.24 | 8.9 | 10.23 | 6.5 |
| Total Debt (M) | $8,598 | $49,496 | $52,676 | $49,317 | $43,217 | $42,645 |
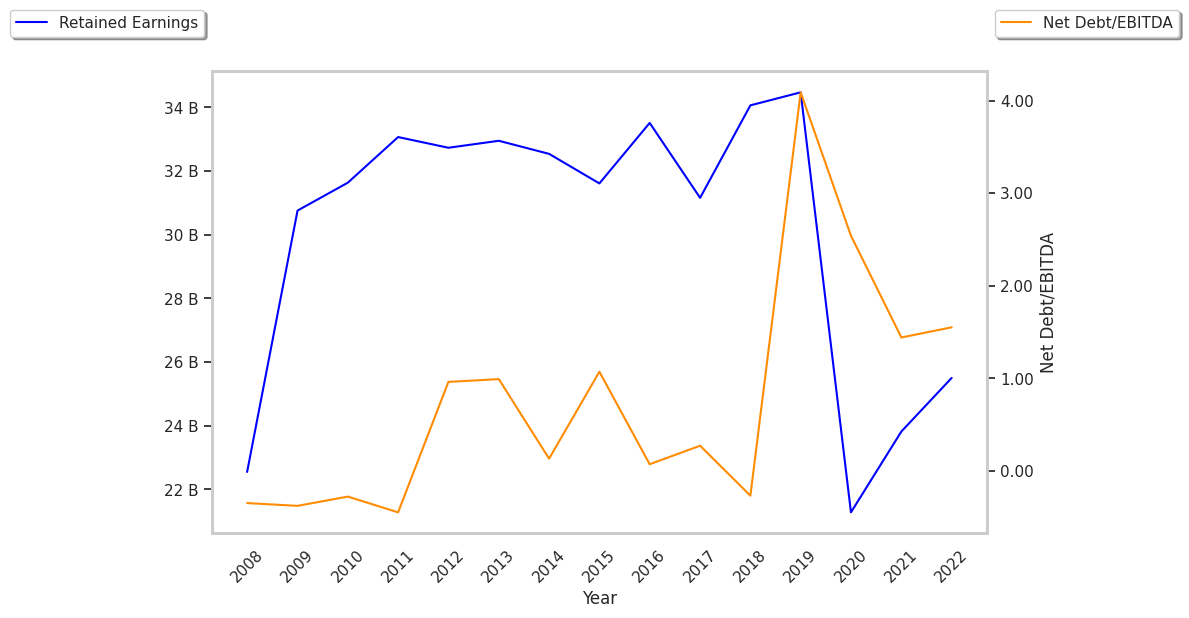
| Net Debt / EBITDA | 0.26 | 5.53 | 10.87 | 1.88 | 1.9 | 1.71 |
| Current Ratio | 1.66 | 1.6 | 1.58 | 1.52 | 1.25 | 1.43 |