Enbridge may be undervalued with poor growth indicators, but the 7 analysts following the company give it an rating of hold. Their target prices range from $33.99 to $41.59 per share, for an average of $39.13. At today's price of $35.59, Enbridge is trading -9.05% away from its average target price, suggesting there is an analyst consensus of some upside potential for the stock.
Enbridge Inc., together with its subsidiaries, operates as an energy infrastructure company. Based in Calgary, Canada, the Large-Cap Energy company has 11,500 full time employees. Enbridge has offered a 10.1% dividend yield over the last 12 months.
Enbridge has a trailing twelve month P/E ratio of 18.3, compared to an average of 14.36 for the Energy sector. Considering its EPS guidance of $2.21, the company has a forward P/E ratio of 16.1.
On the other hand, the market is potentially undervaluing Enbridge in terms of its book value because its P/B ratio is 1.32. In comparison, the sector average P/B ratio is 2.1. The company's shares are currently -18.5% above their Graham number, which suggests that they are not trading at a fair value in terms of earnings and net assets.
Why would analysts be giving such an undervalued stock a bad rating? It's possible that analysts are looking beyond common valuation metrics and taking into account the company's potentially irresponsible use of debt to operate its business. They likely put significant weight behind Enbridge's perceived lack of growth potential, as signaled by its -2.0% rate of revenue growth and capital expenditures that are declining at -3.3%.
| 2018 | 2019 | 2020 | 2021 | 2022 | 2023 | |
|---|---|---|---|---|---|---|
| Revenue (M) | $46,378 | $50,069 | $39,087 | $47,071 | $53,309 | $43,649 |
| Operating Margins | 10% | 16% | 20% | 17% | 10% | 20% |
| Net Margins | 6% | 11% | 9% | 13% | 6% | 14% |
| Net Income (M) | $2,882 | $5,705 | $3,363 | $6,189 | $3,003 | $6,191 |
| Net Interest Expense (M) | $2,703 | $2,663 | $2,790 | $2,655 | $3,179 | $3,812 |
| Depreciation & Amort. (M) | $3,246 | $3,391 | $3,712 | $3,852 | $4,317 | $4,613 |
| Diluted Shares (M) | 1,727 | 2,020 | 2,021 | 2,025 | 2,029 | 2,058 |
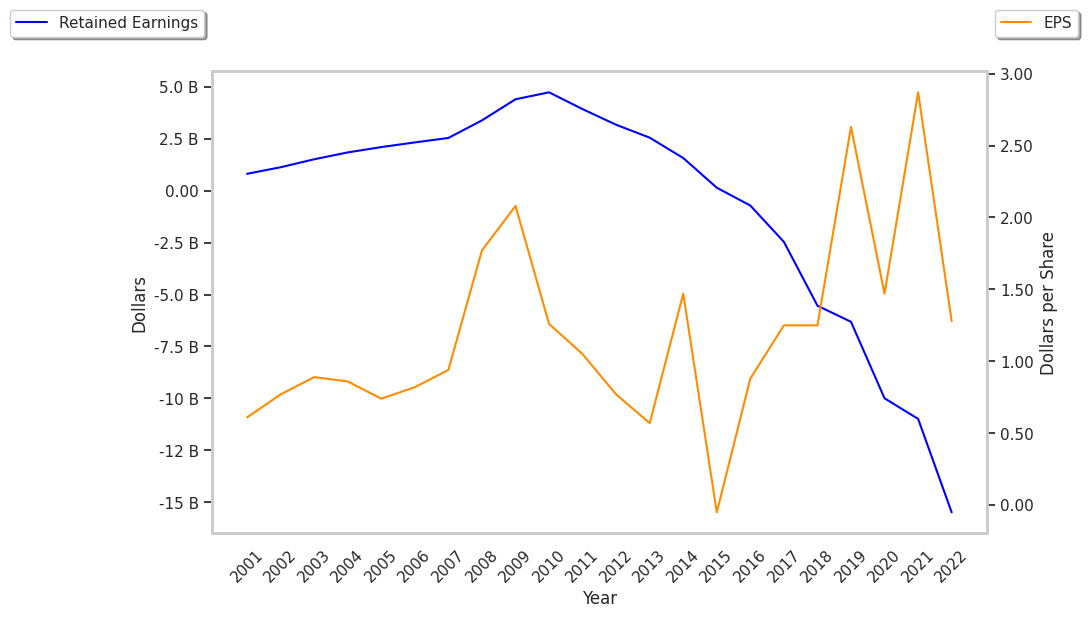
| Earnings Per Share | $1.46 | $2.63 | $1.48 | $2.87 | $1.28 | $2.84 |
| EPS Growth | n/a | 80.14% | -43.73% | 93.92% | -55.4% | 121.87% |
| Avg. Price | $24.0 | $27.59 | $26.38 | $33.77 | $40.34 | $35.62 |
| P/E Ratio | 16.44 | 10.45 | 17.82 | 11.77 | 31.52 | 12.54 |
| Free Cash Flow (M) | $3,696 | $5,205 | $4,376 | $1,438 | $6,583 | $9,547 |
| CAPEX (M) | $6,806 | $4,193 | $5,405 | $7,818 | $4,647 | $4,654 |
| EV / EBITDA | 12.87 | 10.23 | 10.18 | 12.2 | 16.84 | 11.08 |
| Total Debt (M) | $63,586 | $64,065 | $65,776 | $74,125 | $78,984 | $80,799 |
| Net Debt / EBITDA | 7.82 | 5.44 | 5.6 | 6.33 | 8.23 | 5.65 |
| Current Ratio | 0.58 | 0.55 | 0.53 | 0.49 | 0.6 | 0.83 |