TC Energy logged a -0.4% change during today's afternoon session, and is now trading at a price of $37.68 per share.
Over the last year, TC Energy logged a -4.6% change, with its stock price reaching a high of $41.03 and a low of $32.52. Over the same period, the stock underperformed the S&P 500 index by -27.8%. AThe company's 50-day average price was $37.94. TC Energy Corporation operates as an energy infrastructure company in North America. Based in Calgary, Canada, the Large-Cap Utilities company has 7,000 full time employees. TC Energy has returned a 9.9% dividend yield over the last 12 months, but this may not be sustainable seen that the company has a choppy cash flow record.
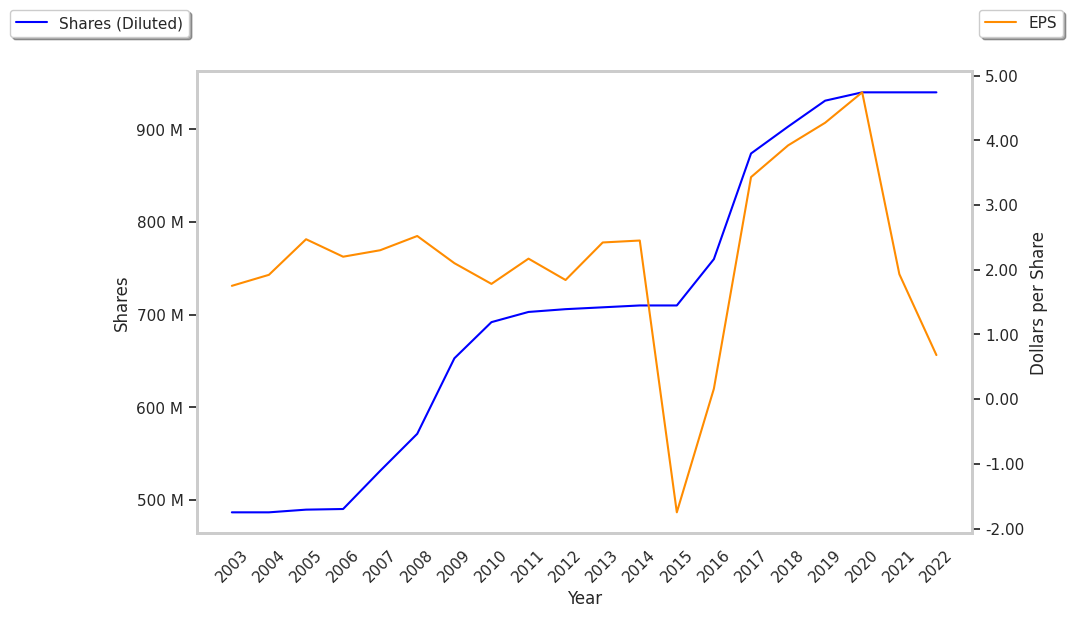
The Firm Has a Declining EPS Growth Trend:
| 2018 | 2019 | 2020 | 2021 | 2022 | 2023 | |
|---|---|---|---|---|---|---|
| Revenue (M) | $13,679 | $13,255 | $12,999 | $13,387 | $14,977 | $15,934 |
| Operating Margins | 42% | 50% | 52% | 30% | 24% | 39% |
| Net Margins | 27% | 31% | 36% | 15% | 5% | 18% |
| Net Income (M) | $3,702 | $4,140 | $4,616 | $1,955 | $748 | $2,922 |
| Net Interest Expense (M) | -$1,815 | -$1,398 | -$1,666 | -$1,893 | -$2,258 | -$2,126 |
| Depreciation & Amort. (M) | $2,350 | $2,464 | $2,590 | $2,522 | $2,584 | $2,778 |
| Diluted Shares (M) | 903 | 931 | 940 | 974 | 996 | 1,030 |
| Earnings Per Share | $3.92 | $4.27 | $4.74 | $1.86 | $0.64 | $2.75 |
| EPS Growth | n/a | 8.93% | 11.01% | -60.76% | -65.59% | 329.69% |
| Avg. Price | $31.43 | $37.47 | $37.52 | $41.72 | $48.94 | $37.71 |
| P/E Ratio | 8.02 | 8.75 | 7.92 | 22.31 | 76.47 | 13.71 |
| Free Cash Flow (M) | -$2,863 | -$393 | -$1,842 | -$244 | -$2,586 | -$5,030 |
| CAPEX (M) | $9,418 | $7,475 | $8,900 | $7,134 | $8,961 | $12,298 |
| Current Ratio | 0.4 | 0.59 | 0.43 | 0.57 | 0.43 | 0.96 |
TC Energy has declining EPS growth, negative cash flows, and not enough current assets to cover current liabilities because its current ratio is 0.96. On the other hand, the company has growing revenues and increasing reinvestment in the business working in its favor. Furthermore, TC Energy has decent operating margins with a stable trend.
The Market May Be Undervaluing TC Energy's Assets and Equity:
TC Energy has a trailing twelve month P/E ratio of 19.8, compared to an average of 20.35 for the Utilities sector. Based on its EPS guidance of $3.07, the company has a forward P/E ratio of 12.4. The -3.4% compound average growth rate of TC Energy's historical and projected earnings per share yields a PEG ratio of -5.76. This indicates that its shares are overvalued.In contrast, the market is likely undervaluing TC Energy in terms of its equity because its P/B ratio is 1.42 while the sector average is 2.27. The company's shares are currently trading -10.6% above their Graham number.
TC Energy Has an Analyst Consensus of Some Upside Potential:
The 8 analysts following TC Energy have set target prices ranging from $31.99 to $71.97 per share, for an average of $44.19 with a hold rating. The company is trading -14.7% away from its average target price, indicating that there is an analyst consensus of some upside potential.
The largest shareholder is Royal Bank of Canada, whose 9% stake in the company is worth $3,531,202,517.