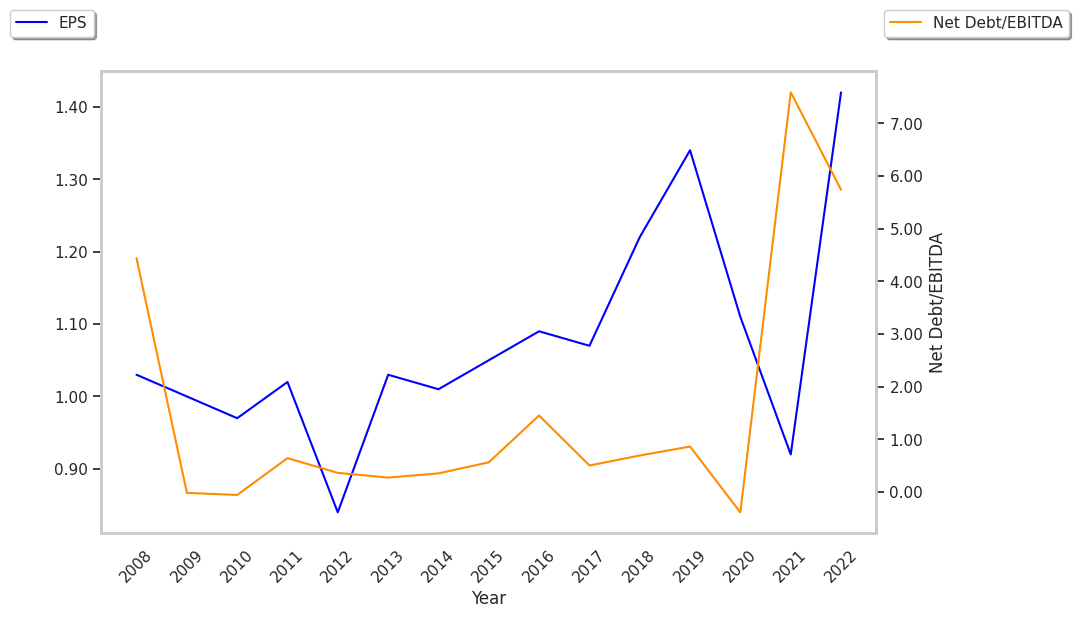
Shares of Real Estate sector company Realty Income moved 1.2% today, and are now trading at a price of $53.09. The Large-Cap stock's daily volume was 3,378,469 compared to its average volume of 5,501,430. The S&P 500 index returned a 1.0% performance.
Realty Income, The Monthly Dividend Company, is an S&P 500 company and member of the S&P 500 Dividend Aristocrats index. The company is based in San Diego and has 418 full time employees. Its market capitalization is $46,229,393,408. Realty Income currently offers its equity investors a dividend that yields 5.9% per year.
14 analysts are following Realty Income and have set target prices ranging from $56.0 to $70.0 per share. On average, they have given the company a rating of buy. At today's prices, O is trading -11.58% away from its average analyst target price of $60.04 per share.
Over the last year, O shares have gone down by -10.5%, which represents a difference of -36.8% when compared to the S&P 500. The stock's 52 week high is $64.18 per share and its 52 week low is $45.04. With average free cash flows of $1.62 Billion that have been growing at an average rate of 24.1% over the last 5 years, Realty Income declining stock performance may not be reflective of the quality of its underlying business.
| Date Reported | Cash Flow from Operations ($ k) | Capital expenditures ($ k) | Free Cash Flow ($ k) | YoY Growth (%) |
|---|---|---|---|---|
| 2023 | 2,958,769 | 68,692 | 2,890,077 | 17.09 |
| 2022 | 2,563,856 | 95,514 | 2,468,342 | 89.42 |
| 2021 | 1,322,189 | 19,080 | 1,303,109 | 17.73 |
| 2020 | 1,115,543 | 8,708 | 1,106,835 | 5.88 |
| 2019 | 1,068,937 | 23,536 | 1,045,401 | 14.2 |
| 2018 | 940,742 | 25,350 | 915,392 |


