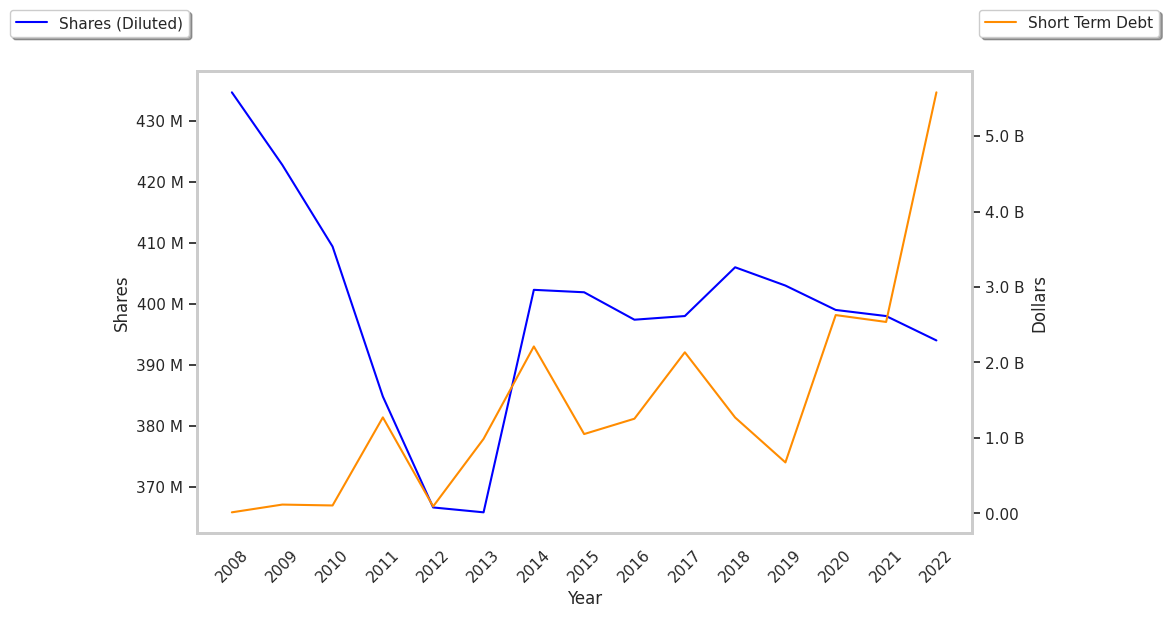
A strong performer from today's morning trading session is Thermo Fisher Scientific, whose shares rose 1.1% to $614.54 per share. For those of you thinking about investing in the stock, here is a brief value analysis of the stock using the company's basic fundamental ratios.
Thermo Fisher Scientific's Valuation Is in Line With Its Sector Averages:
Thermo Fisher Scientific Inc. provides life sciences solutions, analytical instruments, specialty diagnostics, and laboratory products and biopharma services in the North America, Europe, Asia-Pacific, and internationally. The company belongs to the Industrials sector, which has an average price to earnings (P/E) ratio of 25.19 and an average price to book (P/B) ratio of 3.17. In contrast, Thermo Fisher Scientific has a trailing 12 month P/E ratio of 38.2 and a P/B ratio of 4.95.
Thermo Fisher Scientific's PEG ratio is 3.91, which shows that the stock is probably overvalued in terms of its estimated growth. For reference, a PEG ratio near or below 1 is a potential signal that a company is undervalued.
Strong Revenue Growth but Significant Leverage Levels:
| 2018 | 2019 | 2020 | 2021 | 2022 | 2023 | |
|---|---|---|---|---|---|---|
| Revenue (M) | $24,358 | $25,542 | $32,218 | $39,211 | $44,915 | $42,857 |
| Operating Margins | 16% | 18% | 24% | 26% | 19% | 16% |
| Net Margins | 12% | 14% | 20% | 20% | 15% | 14% |
| Net Income (M) | $2,938 | $3,696 | $6,375 | $7,728 | $6,960 | $5,955 |
| Net Interest Expense (M) | $667 | $676 | $553 | $536 | $726 | $1,375 |
| Depreciation & Amort. (M) | $2,267 | $564 | $658 | $831 | $986 | $1,068 |
| Diluted Shares (M) | 406 | 403 | 399 | 397 | 394 | 388 |
| Earnings Per Share | $7.24 | $9.17 | $15.96 | $19.46 | $17.63 | $15.45 |
| EPS Growth | n/a | 26.66% | 74.05% | 21.93% | -9.4% | -12.37% |
| Avg. Price | $219.09 | $276.26 | $381.32 | $529.06 | $560.27 | $614.54 |
| P/E Ratio | 29.97 | 29.9 | 23.7 | 26.97 | 31.56 | 39.6 |
| Free Cash Flow (M) | $3,785 | $4,047 | $6,815 | $6,789 | $6,911 | $6,927 |
| CAPEX (M) | $758 | $926 | $1,474 | $2,523 | $2,243 | $1,479 |
| EV / EBITDA | 17.34 | 24.48 | 19.65 | 21.98 | 26.14 | 33.27 |
| Total Debt (M) | $18,990 | $18,428 | $24,356 | $34,870 | $34,488 | $34,917 |
| Net Debt / EBITDA | 2.79 | 3.11 | 1.66 | 2.8 | 2.77 | 3.39 |
| Current Ratio | 1.73 | 1.92 | 2.13 | 1.5 | 1.48 | 1.75 |
Thermo Fisher Scientific benefits from rapidly growing revenues and increasing reinvestment in the business, generally positive cash flows, and strong operating margins with a stable trend. The company's financial statements show a strong EPS growth trend and a decent current ratio of 1.75. Furthermore, Thermo Fisher Scientific has significant leverage levels.


