Residential Construction company D.R. Horton is standing out today, surging to $194.8 and marking a 3.2% change. In comparison the S&P 500 moved only 1.0%.
DHI currently sits within range of its analyst target price of $188.09, which implies that its price may remain stable for the near future.
Surprisingly, analysts give the stock an average rating of buy, which shows that they believe prices could continue to move. Over the last year, D.R. Horton shares have outperformed the S&P 500 by 45.8%, with a price change of 72.1%.
D.R. Horton, Inc. operates as a homebuilding company in East, North, Southeast, South Central, Southwest, and Northwest regions in the United States. The company is a consumer cyclical company, whose sales and revenues correlate with periods of economic expansion and contraction. The reason behind this is that when the economy is growing, the average consumer has more money to spend on the discretionary (non necessary) products that cyclical consumer companies tend to offer. Consumer cyclical stocks may offer more growth potential than non-cyclical or defensive stocks, but at the expense of higher volatility.
D.R. Horton's trailing 12 month P/E ratio is 13.1, based on its trailing EPS of $14.86. The company has a forward P/E ratio of 12.2 according to its forward EPS of $15.97 -- which is an estimate of what its earnings will look like in the next quarter.
As of the second quarter of 2024, the average Price to Earnings (P/E) ratio for US consumer discretionary companies is 22.15, and the S&P 500 has an average of 28.21. The P/E ratio consists in the stock's share price divided by its earnings per share (EPS), representing how much investors are willing to spend for each dollar of the company's earnings. Earnings are the company's revenues minus the cost of goods sold, overhead, and taxes.
We can take the price to earnings analysis one step further by dividing the P/E ratio by the company's projected five-year growth rate, which gives us its Price to Earnings Growth, or PEG ratio. This ratio is important because it allows us to identify companies that have a low price to earnings ratio because of low growth expectations, or conversely, companies with high P/E ratios because growth is expected to take off.
D.R. Horton's PEG ratio of 1.68 indicates that its P/E ratio is fair compared to its projected earnings growth. In other words, the company's valuation accurately reflects its estimated growth potential. The caveat, however, is that these growth estimates could turn out to be inaccurate.
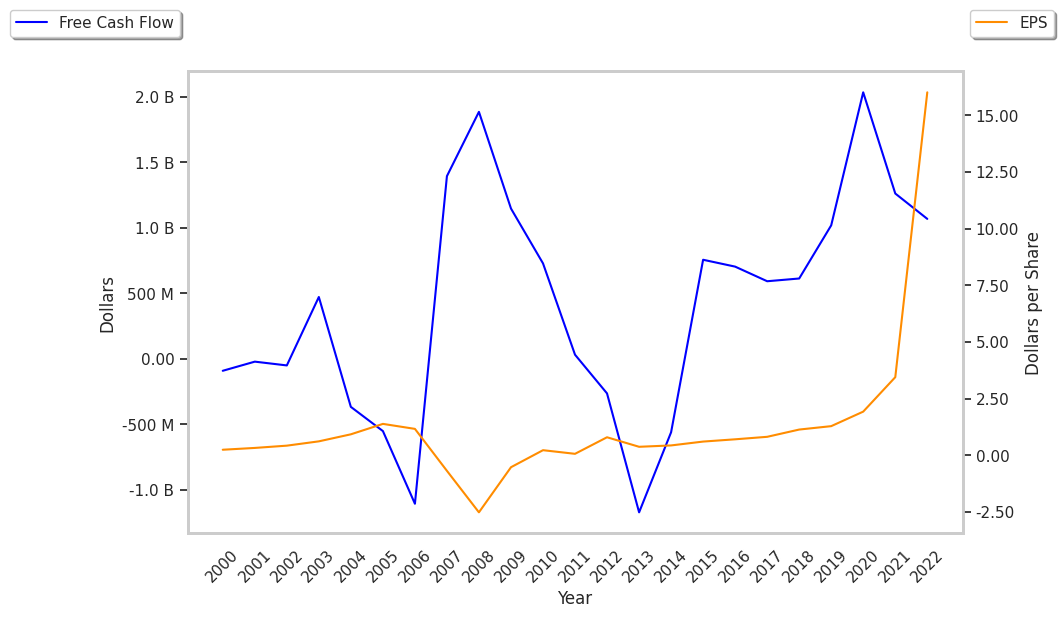
Another key to assessing a company's health is to look at its free cash flow, which is calculated on the basis of its total cash flow from operating activities minus its capital expenditures. Capital expenditures are the costs of maintaining fixed assets such as land, buildings, and equipment. From D.R. Horton's last four annual reports, we are able to obtain the following rundown of its free cash flow:
| Date Reported | Cash Flow from Operations ($ k) | Capital expenditures ($ k) | Free Cash Flow ($ k) | YoY Growth (%) |
|---|---|---|---|---|
| 2023 | 4,304,100 | 148,600 | 4,155,500 | 904.71 |
| 2022 | 561,800 | 148,200 | 413,600 | -6.19 |
| 2021 | 534,400 | 93,500 | 440,900 | -66.73 |
| 2020 | 1,421,600 | 96,500 | 1,325,100 | 73.24 |
| 2019 | 892,100 | 127,200 | 764,900 | 60.32 |
| 2018 | 545,200 | 68,100 | 477,100 |
- Average free cash flow: $1.26 Billion
- Average free cash flown growth rate: 46.3 %
- Coefficient of variability (the lower the better): 0.0 %
With its positive cash flow, the company can not only re-invest in its business, it can offer regular returns to its equity investors in the form of dividends. Over the last 12 months, investors in DHI have received an annualized dividend yield of 0.6% on their capital.
Another valuation metric for analyzing a stock is its Price to Book (P/B) Ratio, which consists in its share price divided by its book value per share. The book value refers to the present liquidation value of the company, as if it sold all of its assets and paid off all debts.
D.R. Horton has a P/B ratio of 2.59. This indicates that the market value of the company exceeds its book value by a factor of more than 2, but is still below the average P/B ratio of the Consumer Discretionary sector, which stood at 3.11 as of the second quarter of 2024.
D.R. Horton is by most measures overvalued because it has a Very low P/E ratio, an average P/B ratio, and generally positive cash flows with an upwards trend. The stock has strong growth indicators because it has a a PEG ratio of less than 1 and strong operating margins with a positive growth rate. We hope you enjoyed this overview of DHI's fundamentals.