Standing out among the Street's worst performers today is Ford Motor, a auto manufacturers company whose shares slumped -7.0% to a price of $9.3, 17.85% below its average analyst target price of $11.33.
The average analyst rating for the stock is hold. F lagged the S&P 500 index by -7.0% so far today and by -43.3% over the last year, returning -22.0%.
Ford Motor Company develops, delivers, and services a range of Ford trucks, commercial cars and vans, sport utility vehicles, and Lincoln luxury vehicles worldwide. The company is a consumer cyclical company, whose sales figures depend on discretionary income levels in its consumer base. For this reason, consumer cyclical companies have better sales and stock performance during periods of economic growth, when consumers have more of an incentive to spend their money on non-essential items.
Ford Motor's trailing 12 month P/E ratio is 10.6, based on its trailing EPS of $0.88. The company has a forward P/E ratio of 5.4 according to its forward EPS of $1.75 -- which is an estimate of what its earnings will look like in the next quarter. As of the third quarter of 2024, the average Price to Earnings (P/E) ratio for US consumer discretionary companies is 22.6, and the S&P 500 has an average of 29.3. The P/E ratio consists in the stock's share price divided by its earnings per share (EPS), representing how much investors are willing to spend for each dollar of the company's earnings. Earnings are the company's revenues minus the cost of goods sold, overhead, and taxes.
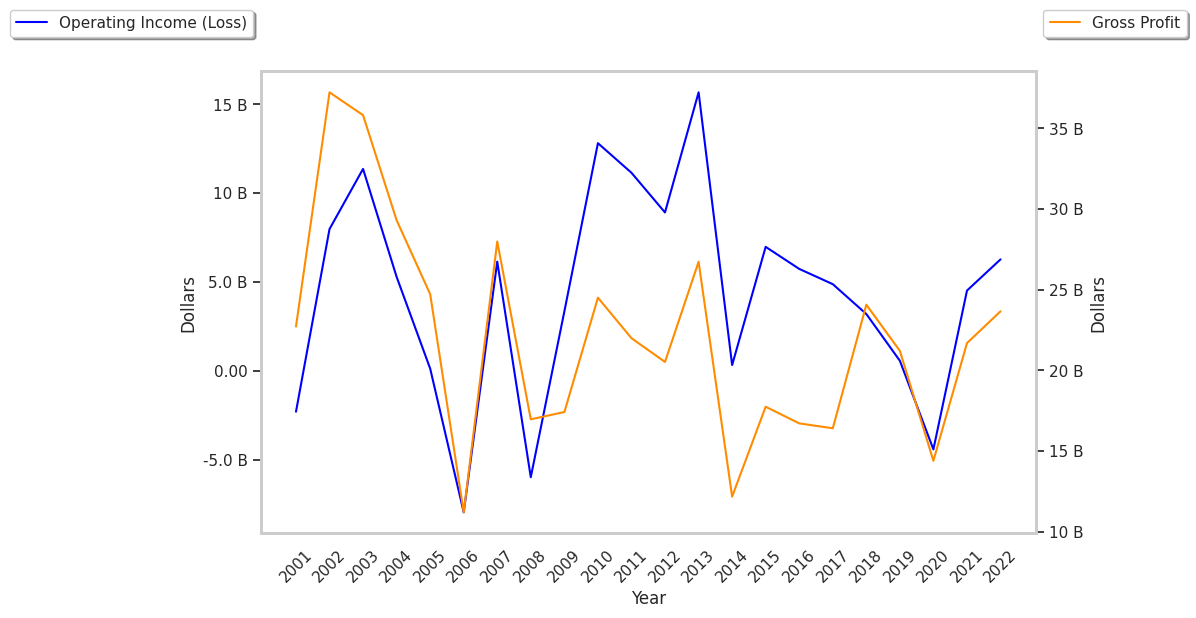
When we subtract capital expenditures from operating cash flows, we are left with the company's free cash flow, which for Ford Motor was $6.68 Billion as of its last annual report. Free cash flow represents the amount of money available for reinvestment in the business or for payments to equity investors in the form of a dividend. In F's case the cash flow outlook is weak. It's average cash flow over the last 4 years has been $8.67 Billion and they've been growing at an average rate of -5.0%.
Value investors often analyze stocks through the lens of its Price to Book (P/B) Ratio (its share price divided by its book value). The book value refers to the present value of the company if the company were to sell off all of its assets and pay all of its debts today - a number whose value may differ significantly depending on the accounting method. Ford motor's P/B ratio of 0.83 indicates that the market value of the company is less than the value of its assets -- a potential indicator of an undervalued stock. The average P/B ratio of the Consumer Discretionary sector was 3.19 as of the third quarter of 2024.
Ford Motor is likely fairly valued at today's prices because it has a Very low P/E ratio, an exceptionally low P/B ratio., and positive cash flows with a flat trend. The stock has poor growth indicators because of its weak operating margins with a stable trend, and an average PEG ratio. We hope this preliminary analysis will encourage you to do your own research into F's fundamental values -- especially their trends over the last few years, which provide the clearest picture of the company's valuation.