It's been a great morning session for Suncor Energy investors, who saw their shares rise 1.7% to a price of $40.19 per share. At these higher prices, is the company still fairly valued? If you are thinking about investing, make sure to check the company's fundamentals before making a decision.
Suncor Energy Has Attractive P/B and P/E Ratios:
Suncor Energy Inc. operates as an integrated energy company in Canada, the United States, and internationally. The company belongs to the Energy sector, which has an average price to earnings (P/E) ratio of 13.62 and an average price to book (P/B) ratio of 1.86. In contrast, Suncor Energy has a trailing 12 month P/E ratio of 12.2 and a P/B ratio of 1.12.
Suncor Energy has moved 25.2% over the last year compared to 22.5% for the S&P 500 — a difference of 2.7%. Suncor Energy has a 52 week high of $41.95 and a 52 week low of $31.25.
Generally Positive Cash Flows and an Average Current Ratio:
| 2018 | 2019 | 2020 | 2021 | 2022 | 2023 | |
|---|---|---|---|---|---|---|
| Revenue (M) | $38,986 | $38,989 | $25,052 | $39,101 | $62,907 | $52,206 |
| Net Margins | 8% | 7% | -17% | 11% | 14% | 16% |
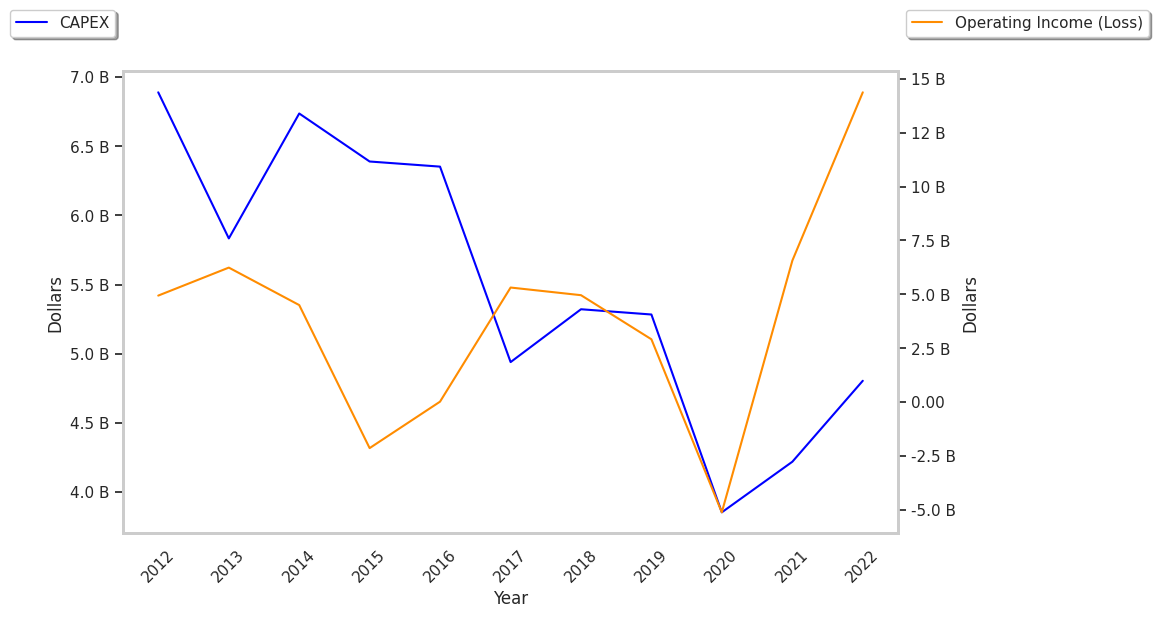
| Net Income (M) | $3,293 | $2,899 | -$4,319 | $4,119 | $9,077 | $8,295 |
| Net Interest Expense (M) | $741 | $875 | $930 | $851 | $814 | $726 |
| Depreciation & Amort. (M) | $5,738 | $10,572 | $9,526 | $5,850 | $8,786 | $6,435 |
| Earnings Per Share | $2.02 | $1.86 | -$2.83 | $2.77 | $6.53 | $6.33 |
| Avg. Price | $30.11 | $26.58 | $16.14 | $19.89 | $31.21 | n/a |
| P/E Ratio | 14.83 | 14.29 | -5.7 | 7.18 | 4.77 | nan |
| Free Cash Flow (M) | $10,580 | $10,421 | $2,675 | $11,764 | $15,680 | $12,344 |
| Total Debt (M) | $13,890 | $12,884 | $13,812 | $13,989 | $9,800 | $11,087 |
| Current Ratio | 0.84 | 0.94 | 0.89 | 1.06 | 1.13 | 1.44 |