Standing out among the Street's worst performers today is Corcept Therapeutics, a pharmaceutical company whose shares slumped -10.5% to a price of $65.79, 32.18% below its average analyst target price of $97.0.
The average analyst rating for the stock is buy. CORT underperformed the S&P 500 index by -10.0% during today's afternoon session, but outpaced it by 199.1% over the last year with a return of 219.8%.
Corcept Therapeutics Incorporated engages in discovery and development of drugs for the treatment of severe endocrinologic, oncologic, metabolic, and neurologic disorders in the United States. The company is part of the healthcare sector. Healthcare companies work in incredibly complex markets, and their valuations can change in an instant based on a denied drug approval, a research and development breakthrough at a competitor, or a new government regulation. In the longer term, healthcare companies are affected by factors as varied as demographics and epidemiology. Investors who want to understand the healthcare market should be prepared for deep dives into a wide range of topics.
Corcept Therapeutics's trailing 12 month P/E ratio is 52.2, based on its trailing EPS of $1.26. The company has a forward P/E ratio of 30.7 according to its forward EPS of $1.75 -- which is an estimate of what its earnings will look like in the next quarter. As of the third quarter of 2024, the average Price to Earnings (P/E) ratio for US health care companies is 26.07, and the S&P 500 has an average of 29.3. The P/E ratio consists in the stock's share price divided by its earnings per share (EPS), representing how much investors are willing to spend for each dollar of the company's earnings. Earnings are the company's revenues minus the cost of goods sold, overhead, and taxes.
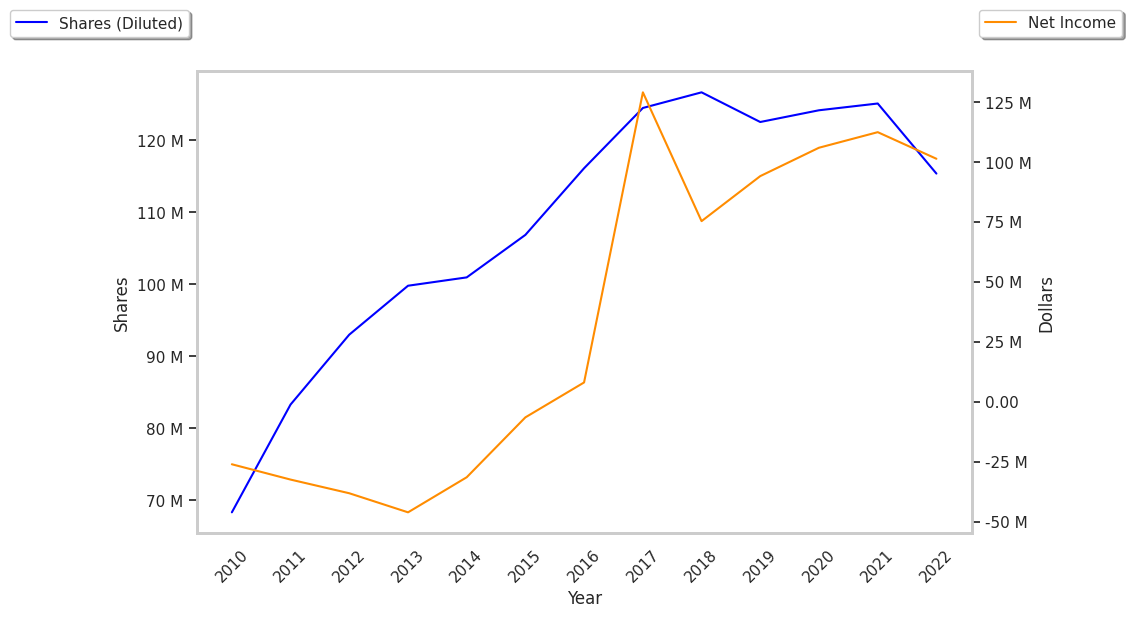
To deepen our understanding of the company's finances, we should study the effect of its depreciation and capital expenditures on the company's bottom line. We can see the effect of these additional factors in Corcept Therapeutics's free cash flow, which was $126.9 Million as of its most recent annual report. Free cash flow represents the amount of money available for reinvestment in the business or for payments to equity investors in the form of a dividend. In CORT's case the cash flow outlook is weak. It's average cash flow over the last 4 years has been $135.89 Million and they've been growing at an average rate of 0.3%.
Value investors often analyze stocks through the lens of its Price to Book (P/B) Ratio (its share price divided by its book value). The book value refers to the present value of the company if the company were to sell off all of its assets and pay all of its debts today - a number whose value may differ significantly depending on the accounting method. Corcept therapeutics's P/B ratio is 10.78 -- in other words, the market value of the company exceeds its book value by a factor of more than 10, so the company's assets may be overvalued compared to the average P/B ratio of the Health Care sector, which stands at 3.53 as of the third quarter of 2024.
Corcept Therapeutics is likely fairly valued at today's prices because it has a higher P/E ratio than its sector average, a higher than Average P/B Ratio, and positive cash flows with a flat trend. The stock has poor growth indicators because of its decent operating margins with a negative growth trend, and an inflated PEG ratio. We hope this preliminary analysis will encourage you to do your own research into CORT's fundamental values -- especially their trends over the last few years, which provide the clearest picture of the company's valuation.