Today we're going to take a closer look at Large-Cap Industrials company Dow, whose shares are currently trading at $35.75. We've been asking ourselves whether the company is under or over valued at today's prices... let's perform a brief value analysis to find out!
a Lower P/B Ratio Than Its Sector Average but Priced at a Premium:
Dow Inc., through its subsidiaries, provides various materials science solutions for packaging, infrastructure, mobility, and consumer applications in the United States, Canada, Europe, the Middle East, Africa, India, the Asia Pacific, and Latin America. The company belongs to the Industrials sector, which has an average price to earnings (P/E) ratio of 25.42 and an average price to book (P/B) ratio of 3.2. In contrast, Dow has a trailing 12 month P/E ratio of 22.8 and a P/B ratio of 1.45.
Dow has moved -36.7% over the last year compared to 15.2% for the S&P 500 -- a difference of -51.9%. Dow has a 52 week high of $60.69 and a 52 week low of $35.49.
Increasing Revenues but Narrowing Margins:
| 2018 | 2019 | 2020 | 2021 | 2022 | 2023 | |
|---|---|---|---|---|---|---|
| Revenue (M) | $49,604 | $42,951 | $38,542 | $54,968 | $56,902 | $44,622 |
| Operating Margins | 8% | -3% | 5% | 15% | 11% | 1% |
| Net Margins | 9% | -3% | 3% | 12% | 8% | 1% |
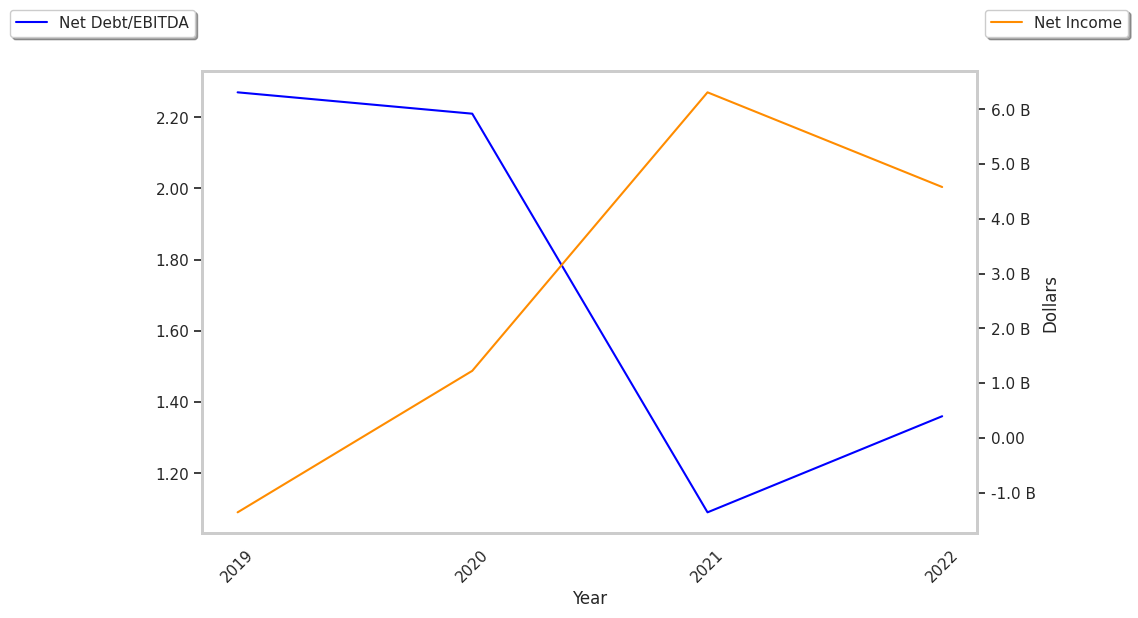
| Net Income (M) | $4,641 | -$1,272 | $1,294 | $6,405 | $4,640 | $660 |
| Net Interest Expense (M) | $1,063 | $933 | $827 | $731 | $662 | $746 |
| Depreciation & Amort. (M) | $2,174 | $419 | $2,874 | $2,842 | $2,758 | $2,611 |
| Diluted Shares (M) | 747 | 742 | 742 | 749 | 726 | 709 |
| Earnings Per Share | $6.21 | -$1.84 | $1.64 | $8.38 | $6.28 | $0.82 |
| EPS Growth | n/a | -129.63% | 189.13% | 410.98% | -25.06% | -86.94% |
| Free Cash Flow (M) | $2,163 | $3,969 | $7,067 | $9,923 | $5,652 | $2,840 |
| CAPEX (M) | $2,091 | $1,961 | $841 | $2,914 | $1,823 | $2,356 |
| Total Debt (M) | $19,591 | $15,975 | $16,491 | $14,280 | $14,698 | $14,907 |
| Net Debt / EBITDA | 2.85 | -16.43 | 2.3 | 1.03 | 1.22 | 3.65 |
| Current Ratio | 2.53 | 1.57 | 1.72 | 1.58 | 1.81 | 1.77 |
Dow has weak operating margins with a negative growth trend, declining EPS growth, and a highly leveraged balance sheet. On the other hand, the company benefits from slight revenue growth and increasing reinvestment in the business and a decent current ratio of 1.77. Furthermore, Dow has positive cash flows.