One of Wall Street's biggest winners of the day is Exact Sciences, a medical specialities company whose shares have climbed 3.4% to a price of $44.49 -- 35.92% below its average analyst target price of $69.43.
The average analyst rating for the stock is buy. EXAS may have outstripped the S&P 500 index by 2.0% so far today, but it has lagged behind the index by 33.3% over the last year, returning -25.4%.
Exact Sciences Corporation provides cancer screening and diagnostic test products in the United States and internationally. The company is part of the healthcare sector. Healthcare companies work in incredibly complex markets, and their valuations can change in an instant based on a denied drug approval, a research and development breakthrough at a competitor, or a new government regulation. In the longer term, healthcare companies are affected by factors as varied as demographics and epidemiology. Investors who want to understand the healthcare market should be prepared for deep dives into a wide range of topics.
Exact Sciences does not publish either its forward or trailing P/E ratios because their values are negative -- meaning that each share of stock represents a net earnings loss. But we can calculate these P/E ratios anyways using the stocks forward and trailing (EPS) values of $-0.34 and $-5.59. We can see that EXAS has a forward P/E ratio of -130.9 and a trailing P/E ratio of -8.0.
As of the third quarter of 2024, the average Price to Earnings (P/E) ratio for US health care companies is 26.07, and the S&P 500 has an average of 29.3. The P/E ratio consists in the stock's share price divided by its earnings per share (EPS), representing how much investors are willing to spend for each dollar of the company's earnings. Earnings are the company's revenues minus the cost of goods sold, overhead, and taxes.
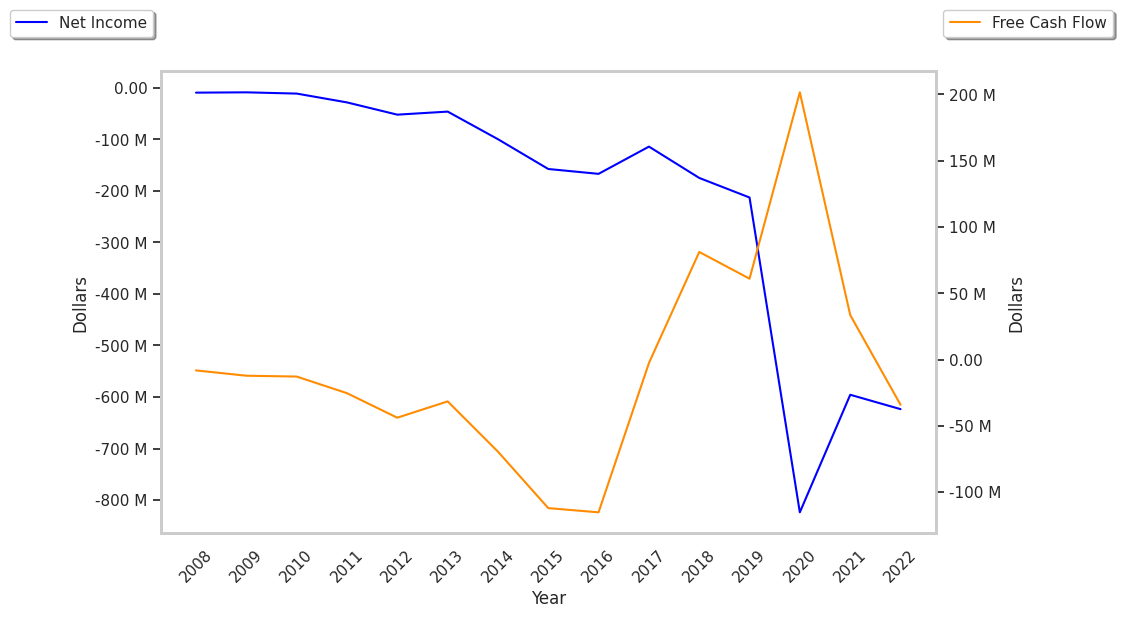
Exact Sciences's financial viability can also be assessed through a review of its free cash flow trends. Free cash flow refers to the company's operating cash flows minus its capital expenditures, which are expenses related to the maintenance of fixed assets such as land, infrastructure, and equipment. Over the last four years, the trends have been as follows:
| Date Reported | Cash Flow from Operations ($ k) | Capital expenditures ($ k) | Free Cash Flow ($ k) | YoY Growth (%) |
|---|---|---|---|---|
| 2023 | 156,119 | 124,190 | 31,929 | 107.29 |
| 2022 | -223,559 | 214,462 | -438,021 | -84.04 |
| 2021 | -102,236 | 135,766 | -238,002 | -433.32 |
| 2020 | 136,482 | 65,078 | 71,404 | 125.11 |
| 2019 | -111,655 | 172,654 | -284,309 | -29.8 |
| 2018 | -68,940 | 150,093 | -219,033 |
- Average free cash flow: $-179338666.7
- Average free cash flown growth rate: 2.8 %
- Coefficient of variability (lower numbers indicating more stability): 0.0 %
Free cash flow represents the amount of money that is available for reinvesting in the business, or for paying out to investors in the form of a dividend. With a positive cash flow as of the last fiscal year, EXAS is in a position to do either -- which can encourage more investors to place their capital in the company.
Value investors often analyze stocks through the lens of its Price to Book (P/B) Ratio (market value divided by book value). The book value refers to the present value of the company if the company were to sell off all of its assets and pay all of its debts today - a number whose value may differ significantly depending on the accounting method.
Exact Sciences has a P/B ratio of 3.44. This indicates that the market value of the company exceeds its book value by a factor of more than 3, but is still below the average P/B ratio of the Health Care sector, which stood at 3.53 as of the third quarter of 2024.
Exact Sciences is by most measures overvalued because it has a negative P/E ratio., an average P/B ratio, and negative cash flows with a flat trend. The stock has poor growth indicators because it has a no PEG ratio and weak operating margins with a positive growth rate. We hope you enjoyed this overview of EXAS's fundamentals.