Now trading at a price of $88.03, Merck & has moved 0.2% so far today.
Merck & returned losses of -33.3% last year, with its stock price reaching a high of $134.63 and a low of $81.04. Over the same period, the stock underperformed the S&P 500 index by -43.4%. AThe company's 50-day average price was $92.98. Merck & Co., Inc. operates as a healthcare company worldwide. Based in Rahway, NJ, the Large-Cap Health Care company has 73,000 full time employees. Merck & has offered a 3.5% dividend yield over the last 12 months.
Increasing Revenues but Narrowing Margins:
| 2018 | 2019 | 2020 | 2021 | 2022 | 2023 | |
|---|---|---|---|---|---|---|
| Revenue (M) | $42,294 | $39,121 | $41,518 | $48,704 | $59,283 | $60,115 |
| Operating Margins | 21% | 18% | 14% | 28% | 28% | 3% |
| Net Margins | 15% | 25% | 17% | 27% | 24% | 1% |
| Net Income (M) | $6,220 | $9,843 | $7,067 | $13,049 | $14,519 | $365 |
| Net Interest Expense (M) | $772 | $893 | $831 | $806 | $962 | $1,146 |
| Depreciation & Amort. (M) | $4,519 | $3,652 | $1,669 | $1,578 | $1,824 | $1,828 |
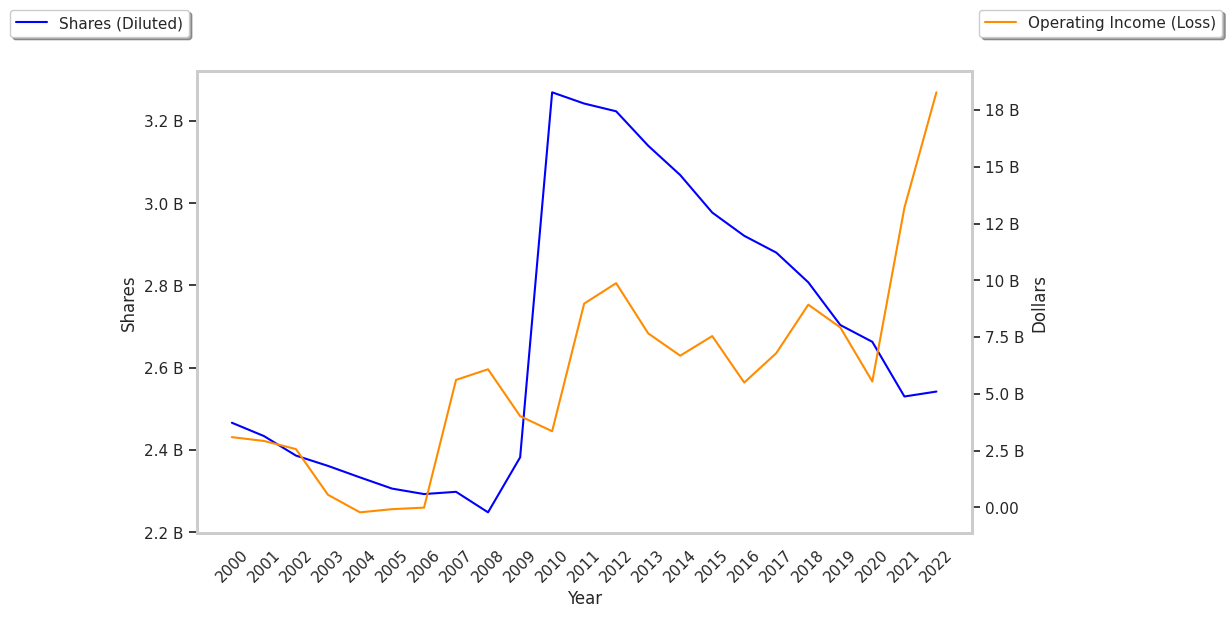
| Diluted Shares (M) | 2,679 | 2,580 | 2,541 | 2,538 | 2,542 | 2,547 |
| Earnings Per Share | $2.32 | $3.81 | $2.78 | $5.14 | $5.71 | $0.14 |
| EPS Growth | n/a | 64.22% | -27.03% | 84.89% | 11.09% | -97.55% |
| Free Cash Flow (M) | $8,307 | $10,071 | $5,824 | $8,674 | $14,707 | $27,089 |
| CAPEX (M) | $2,615 | $3,369 | $4,429 | $4,448 | $4,388 | $14,083 |
| Total Debt (M) | $25,114 | $26,346 | $31,791 | $33,102 | $30,691 | $35,055 |
| Net Debt / EBITDA | 1.3 | 1.54 | 3.15 | 1.62 | 0.99 | 7.59 |
| Current Ratio | 1.17 | 1.24 | 1.02 | 1.27 | 1.47 | 1.25 |
Merck & has weak operating margins with a negative growth trend, declining EPS growth, and a highly leveraged balance sheet. On the other hand, the company benefits from growing revenues and increasing reinvestment in the business and generally positive cash flows. Furthermore, Merck & has just enough current assets to cover current liabilities, as shown by its current ratio of 1.25.
an Increase in Expected Earnings Improves Its Value Outlook but Trading Above Its Fair Price:
Merck & has a trailing twelve month P/E ratio of 13.8, compared to an average of 26.07 for the Health Care sector. Based on its EPS guidance of $9.4, the company has a forward P/E ratio of 9.9. According to the 22.1% compound average growth rate of Merck &'s historical and projected earnings per share, the company's PEG ratio is 0.62. Taking the weighted average of the company's EPS CAGR and the broader market's 5-year projected EPS growth rate, we obtain a normalized growth rate of 14.4%. On this basis, the company's PEG ratio is 0.96. This suggests that its shares are undervalued. In contrast, Merck & is likely overvalued compared to the book value of its equity, since its P/B ratio of 4.8 is higher than the sector average of 3.53. The company's shares are currently trading 1190.7% below their Graham number. Ultimately, Merck &'s strong cash flows, decent earnings multiple, and healthy debt levels factor towards it being fairly valued, its elevated P/B ratio notwithstanding.
Merck & Has an Analyst Consensus of Strong Upside Potential:
The 22 analysts following Merck & have set target prices ranging from $95.0 to $146.0 per share, for an average of $112.07 with a buy rating. The company is trading -21.5% away from its average target price, indicating that there is an analyst consensus of strong upside potential.
Merck & has a very low short interest because 1.5% of the company's shares are sold short. Institutions own 80.4% of the company's shares, and the insider ownership rate stands at 0.07%, suggesting a small amount of insider investors. The largest shareholder is Vanguard Group Inc, whose 10% stake in the company is worth $22,096,457,416.