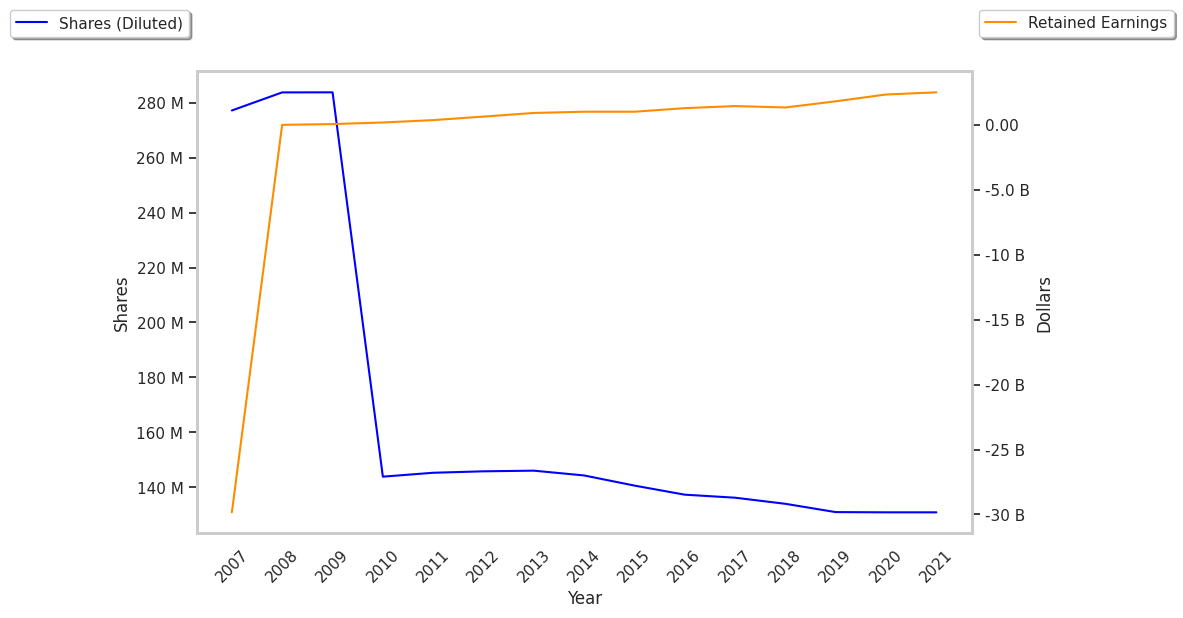
Large-cap Consumer Discretionary company lululemon athletica inc. has moved -0.8% so far today on a volume of 662,487, compared to its average of 1,869,466. In contrast, the S&P 500 index moved -1.0%.
lululemon athletica inc. trades -20.47% away from its average analyst target price of $365.4 per share. The 33 analysts following the stock have set target prices ranging from $194.0 to $500.0, and on average have given lululemon athletica inc. a rating of buy.
If you are considering an investment in LULU, you'll want to know the following:
-
lululemon athletica inc.'s current price is 205.9% above its Graham number of $94.99, which implies that at its current valuation it does not offer a margin of safety
-
lululemon athletica inc. has moved -23.9% over the last year, and the S&P 500 logged a change of 6.4%
-
Based on its trailing earnings per share of 14.65, lululemon athletica inc. has a trailing 12 month Price to Earnings (P/E) ratio of 19.8 while the S&P 500 average is 29.3
-
LULU has a forward P/E ratio of 19.5 based on its forward 12 month price to earnings (EPS) of $14.93 per share
-
Its Price to Book (P/B) ratio is 8.15 compared to its sector average of 3.19
-
lululemon athletica inc., together with its subsidiaries, designs, distributes, and retails technical athletic apparel, footwear, and accessories for women and men under the lululemon brand in the United States, Canada, Mexico, China Mainland, Hong Kong, Taiwan, Macau, and internationally.
-
Based in Vancouver, the company has 39,000 full time employees and a market cap of $35.06 Billion.


