Corteva logged a -1.8% change during today's morning session, and is now trading at a price of $54.79 per share.
Over the last year, Corteva logged a -3.0% change, with its stock price reaching a high of $66.24 and a low of $50.01. Over the same period, the stock returned a similar cumulative performance to the S&P 500. The company's 50-day average price was $62.36.
Corteva, Inc. operates in the agriculture business. Based in Indianapolis, IN, the Large-Cap Consumer Staples company has 22,000 full time employees. Corteva has offered a 1.2% dividend yield over the last 12 months.
A Positive EPS Growth Rate and Growing Revenues:
| 2018 | 2019 | 2020 | 2021 | 2022 | 2023 | |
|---|---|---|---|---|---|---|
| Revenue (M) | $14,287 | $13,846 | $14,217 | $15,655 | $17,455 | $17,226 |
| Operating Margins | -48% | -2% | 5% | 15% | 8% | 6% |
| Net Margins | -35% | -7% | 5% | 11% | 7% | 4% |
| Net Income (M) | -$5,065 | -$959 | $681 | $1,759 | $1,147 | $735 |
| Net Interest Expense (M) | $337 | $136 | $45 | $30 | $79 | $233 |
| Depreciation & Amort. (M) | $518 | $475 | $682 | $722 | $702 | $683 |
| Diluted Shares (M) | 749 | 750 | 751 | 742 | 724 | 712 |
| Earnings Per Share | -$6.76 | -$1.28 | $0.91 | $2.37 | $1.58 | $1.03 |
| EPS Growth | n/a | 81.07% | 171.09% | 160.44% | -33.33% | -34.81% |
| Free Cash Flow (M) | -$1,018 | -$93 | $1,589 | $2,154 | $267 | $1,174 |
| CAPEX (M) | $1,501 | $1,163 | $475 | $573 | $605 | $595 |
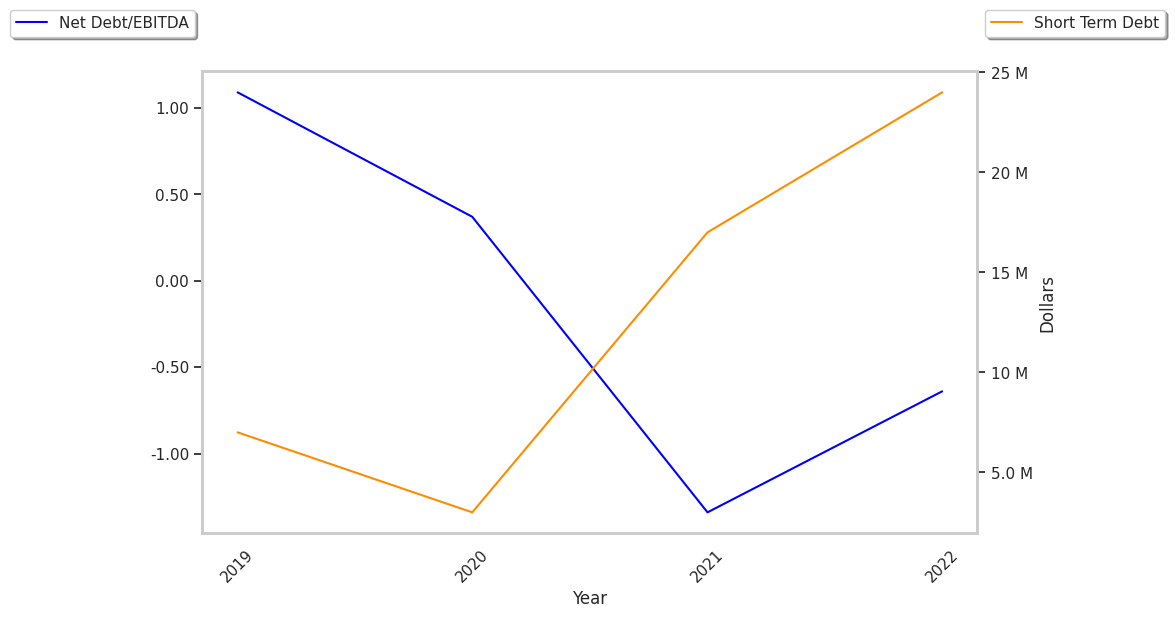
| Total Debt (M) | $7,938 | $122 | $1,105 | $1,117 | $1,307 | $2,489 |
| Net Debt / EBITDA | -0.9 | -10.33 | -1.78 | -1.09 | -0.89 | -0.09 |
| Current Ratio | 1.73 | 1.64 | 1.73 | 1.63 | 1.56 | 1.56 |
Corteva has positive EPS growth and positive cash flows. Additionally, the company's financial statements display a decent current ratio of 1.56 and healthy leverage levels. Furthermore, Corteva has growing revenues and decreasing reinvestment in the business and weak operating margins with a stable trend.
a Lower P/B Ratio Than Its Sector Average but Its Shares Are Expensive:
Corteva has a trailing twelve month P/E ratio of 51.1, compared to an average of 23.09 for the Consumer Staples sector. Based on its EPS guidance of $3.21, the company has a forward P/E ratio of 19.4. The 5.7% compound average growth rate of Corteva's historical and projected earnings per share yields a PEG ratio of 8.96. This suggests that these shares are overvalued. In contrast, the market is likely undervaluing Corteva in terms of its equity because its P/B ratio is 1.58 while the sector average is 3.3. The company's shares are currently trading 91.9% below their Graham number.
Corteva Has an Analyst Consensus of Strong Upside Potential:
The 23 analysts following Corteva have set target prices ranging from $59.0 to $75.0 per share, for an average of $69.3 with a buy rating. The company is trading -20.9% away from its average target price, indicating that there is an analyst consensus of strong upside potential.
Corteva has a very low short interest because 1.7% of the company's shares are sold short. Institutions own 88.2% of the company's shares, and the insider ownership rate stands at 0.09%, suggesting a small amount of insider investors. The largest shareholder is Vanguard Group Inc, whose 12% stake in the company is worth $4,301,371,452.