We've been asking ourselves recently if the market has placed a fair valuation on Exelixis. Let's dive into some of the fundamental values of this Large-Cap Health Care company to determine if there might be an opportunity here for value-minded investors.
a Very Low P/E Ratio but Its Shares Are Expensive:
Exelixis, Inc., an oncology company, focuses on the discovery, development, and commercialization of new medicines for difficult-to-treat cancers in the United States. The company belongs to the Health Care sector, which has an average price to earnings (P/E) ratio of 22.94 and an average price to book (P/B) ratio of 3.19. In contrast, Exelixis has a trailing 12 month P/E ratio of 22.0 and a P/B ratio of 4.86.
Exelixis has moved 63.9% over the last year compared to 9.8% for the S&P 500 -- a difference of 54.1%. Exelixis has a 52 week high of $40.02 and a 52 week low of $20.14.
Increasing Revenues but Narrowing Margins:
| 2017 | 2019 | 2020 | 2021 | 2022 | 2024 | |
|---|---|---|---|---|---|---|
| Revenue (M) | $854 | $968 | $988 | $1,611 | $1,830 | $2,169 |
| Operating Margins | 51% | 38% | 11% | 13% | 9% | 28% |
| Net Margins | 81% | 33% | 11% | 11% | 11% | 24% |
| Net Income (M) | $690 | $321 | $112 | $182 | $208 | $521 |
| Net Interest Expense (M) | n/a | $28 | $20 | $33 | $87 | $77 |
| Depreciation & Amort. (M) | $8 | $8 | $9 | $21 | $26 | $29 |
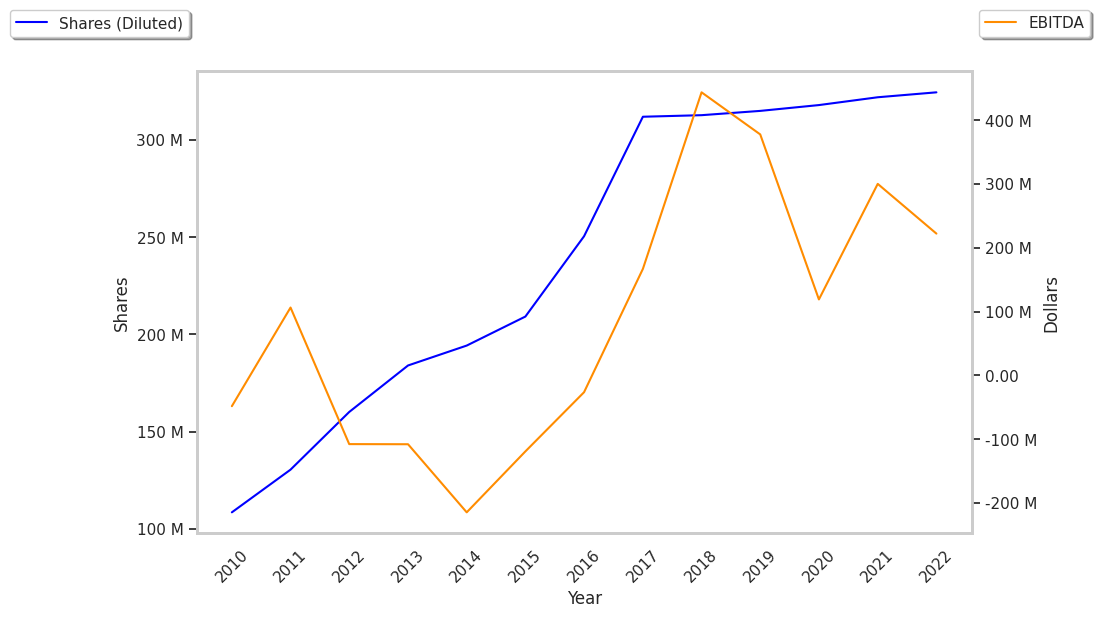
| Diluted Shares (M) | 313 | 309 | 322 | 325 | 321 | 296 |
| Earnings Per Share | $2.21 | $1.02 | $0.35 | $0.56 | $0.65 | $1.76 |
| EPS Growth | n/a | -53.85% | -65.69% | 60.0% | 16.07% | 170.77% |
| Avg. Price | $26.66 | $20.2 | $21.45 | $20.87 | $20.14 | $38.44 |
| P/E Ratio | 11.49 | 19.06 | 59.58 | 36.61 | 30.98 | 21.36 |
| Free Cash Flow (M) | $663 | $514 | $179 | $335 | $293 | $672 |
| CAPEX (M) | $64 | $13 | $30 | $28 | $40 | $28 |
| Current Ratio | 8.5 | 6.99 | 5.43 | 4.99 | 3.34 | 3.63 |
Exelixis has an excellent current ratio of 3.63, rapidly growing revenues and decreasing reinvestment in the business, and generally positive cash flows. However, the firm has declining EPS growth. Finally, we note that Exelixis has decent operating margins with a negative growth trend.