We've been asking ourselves recently if the market has placed a fair valuation on Series. Let's dive into some of the fundamental values of this Large-Cap Health Care company to determine if there might be an opportunity here for value-minded investors.
Series's Valuation Is in Line With Its Sector Averages:
Cencora, Inc. sources and distributes pharmaceutical products in the United States and internationally. The company belongs to the Health Care sector, which has an average price to earnings (P/E) ratio of 22.94 and an average price to book (P/B) ratio of 3.19. In contrast, Series has a trailing 12 month P/E ratio of 34.2 and a P/B ratio of 56.54.
Series has moved 25.9% over the last year compared to 9.2% for the S&P 500 -- a difference of 16.7%. Series has a 52 week high of $309.35 and a 52 week low of $218.65.
Growing Revenues but Not Enough Current Assets to Cover Current Liabilities:
| 2019 | 2020 | 2021 | 2022 | 2023 | 2024 | |
|---|---|---|---|---|---|---|
| Revenue (M) | $179,589 | $189,894 | $213,989 | $238,587 | $262,173 | $293,959 |
| Gross Margins | 3% | 3% | 3% | 3% | 3% | 3% |
| Net Margins | 0% | -2% | 1% | 1% | 1% | 1% |
| Net Income (M) | $855 | -$3,409 | $1,540 | $1,699 | $1,745 | $1,509 |
| Net Interest Expense (M) | -$158 | -$138 | -$174 | -$211 | -$229 | -$157 |
| Depreciation & Amort. (M) | $321 | $291 | $327 | $391 | $419 | $448 |
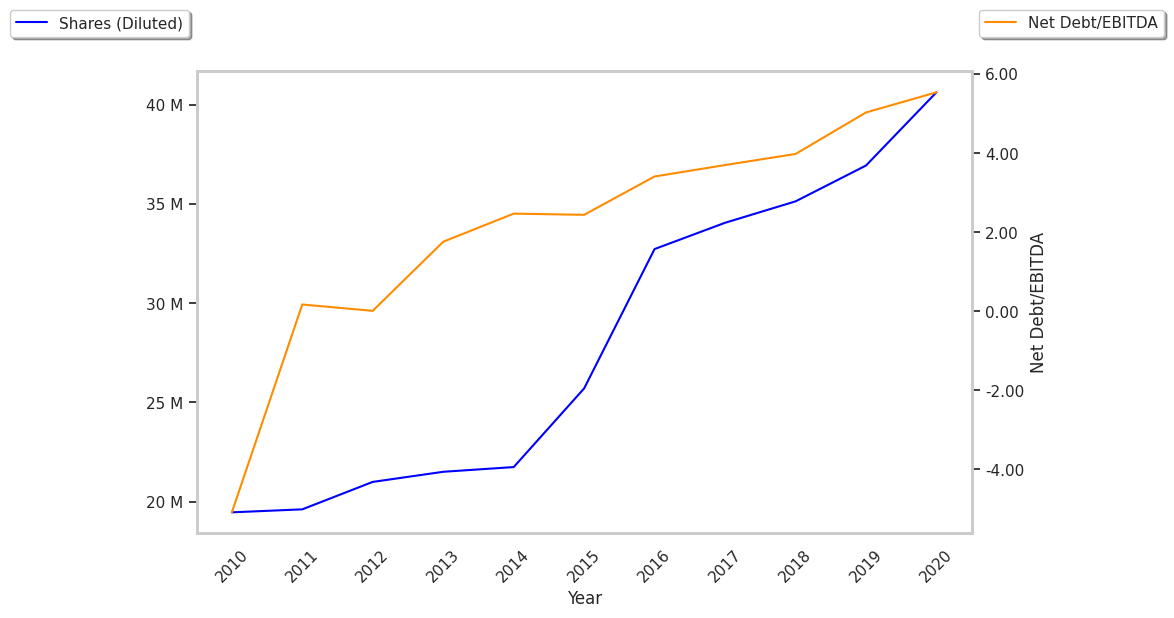
| Diluted Shares (M) | 208 | 207 | 211 | 206 | 202 | 195 |
| Earnings Per Share | $4.04 | -$16.65 | $7.39 | $8.04 | $8.53 | $7.53 |
| EPS Growth | n/a | -512.13% | 144.38% | 8.8% | 6.09% | -11.72% |
| Free Cash Flow (M) | $2,034 | $1,837 | $2,228 | $2,207 | $3,453 | $2,998 |
| CAPEX (M) | $310 | $370 | $438 | $496 | $458 | $487 |
| Total Debt (M) | $4,701 | $3,759 | $6,950 | $6,691 | $5,372 | $10,362 |
| Net Debt / EBITDA | 0.93 | 0.17 | 1.41 | 1.81 | 0.91 | 2.72 |
| Current Ratio | 0.95 | 0.99 | 0.95 | 0.91 | 0.88 | 0.92 |
Series has growing revenues and increasing reinvestment in the business, generally positive cash flows, and a strong EPS growth trend. However, the firm suffers from slimmer gross margins than its peers and not enough current assets to cover current liabilities because its current ratio is 0.92. Finally, we note that Series has significant leverage levels.