Now trading at a price of $275.6, L3Harris Technologies has moved 2.2% so far today.
L3Harris Technologies returned gains of 10.8% last year, with its stock price reaching a high of $280.03 and a low of $193.09. Over the same period, the stock underperformed the S&P 500 index by -7.0%. The company's 50-day average price was $247.6. L3Harris Technologies, Inc. provides mission-critical solutions for government and commercial customers worldwide. Based in Melbourne, FL, the Large-Cap Industrials company has 47,000 full time employees. L3Harris Technologies has offered a 1.7% dividend yield over the last 12 months.
Increasing Revenues but Narrowing Margins:
| 2018 | 2019 | 2020 | 2021 | 2022 | 2024 | |
|---|---|---|---|---|---|---|
| Revenue (M) | $6,801 | $12,856 | $18,194 | $17,062 | $19,419 | $21,325 |
| Operating Margins | 21% | 12% | 12% | 7% | 7% | 9% |
| Net Margins | 14% | 10% | 6% | 6% | 6% | 7% |
| Net Income (M) | $949 | $1,333 | $1,119 | $1,062 | $1,227 | $1,502 |
| Net Interest Expense (M) | -$167 | -$204 | -$254 | -$279 | -$543 | $354 |
| Depreciation & Amort. (M) | $143 | $442 | $323 | $171 | $387 | $1,289 |
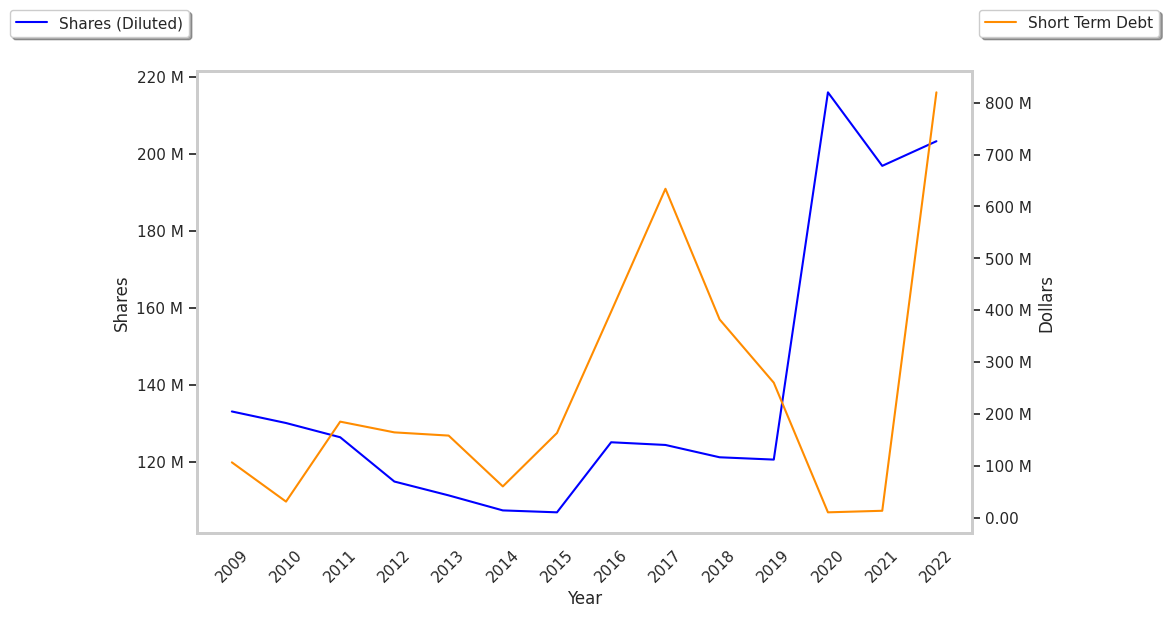
| Diluted Shares (M) | 225 | 215 | 203 | 194 | 191 | 191 |
| Earnings Per Share | $7.86 | $7.89 | $5.19 | $5.49 | $6.44 | $7.87 |
| EPS Growth | n/a | 0.38% | -34.22% | 5.78% | 17.3% | 22.2% |
| Avg. Price | $140.73 | $171.78 | $176.74 | $204.76 | $230.81 | $274.49 |
| P/E Ratio | 17.53 | 21.37 | 33.79 | 36.96 | 35.67 | 34.7 |
| Free Cash Flow (M) | $1,024 | n/a | $2,422 | $1,906 | $1,647 | $2,151 |
| CAPEX (M) | $161 | n/a | $368 | $252 | $449 | $408 |
| EV / EBITDA | 23.53 | 21.93 | 17.08 | 35.2 | 30.25 | 19.58 |
| Total Debt (M) | $6,963 | $6,518 | $7,056 | $7,043 | $11,523 | $11,721 |
| Net Debt / EBITDA | 3.75 | 2.68 | 2.46 | 4.75 | 6.05 | 3.46 |
| Current Ratio | 1.49 | 1.37 | 1.4 | 1.17 | 1.01 | 1.08 |
L3Harris Technologies has flat EPS growth, just enough current assets to cover current liabilities, as shown by its current ratio of 1.08, and significant leverage levels. We also note that the company benefits from rapidly growing revenues and increasing reinvestment in the business and positive cash flows. However, the firm has weak operating margins with a negative growth trend.
L3Harris Technologies's Valuation Is in Line With Its Sector Averages:
L3Harris Technologies has a trailing twelve month P/E ratio of 29.3, compared to an average of 24.03 for the Industrials sector. Based on its EPS guidance of $14.39, the company has a forward P/E ratio of 17.2. The 9.0% compound average growth rate of L3Harris Technologies's historical and projected earnings per share yields a PEG ratio of 3.25. This suggests that these shares are overvalued. In contrast, the market is likely undervaluing L3Harris Technologies in terms of its equity because its P/B ratio is 2.7 while the sector average is 2.89. The company's shares are currently trading 104.7% below their Graham number.
L3Harris Technologies Has an Average Rating of Buy:
The 21 analysts following L3Harris Technologies have set target prices ranging from $229.0 to $324.0 per share, for an average of $273.22 with a buy rating. The company is trading 0.9% away from its average target price, indicating that there is an analyst consensus of little upside potential.
L3Harris Technologies has an average amount of shares sold short because 2.5% of the company's shares are sold short. Institutions own 90.1% of the company's shares, and the insider ownership rate stands at 0.34%, suggesting a small amount of insider investors. The largest shareholder is Vanguard Group Inc, whose 12% stake in the company is worth $6,352,030,164.