L3Harris Technologies shares fell by -1.4% during the day's morning session, and are now trading at a price of $269.28. Is it time to buy the dip? To better answer that question, it's essential to check if the market is valuing the company's shares fairly in terms of its earnings and equity levels.
L3Harris Technologies's Valuation Is in Line With Its Sector Averages:
L3Harris Technologies, Inc. provides mission-critical solutions for government and commercial customers worldwide. The company belongs to the Industrials sector, which has an average price to earnings (P/E) ratio of 24.03 and an average price to book (P/B) ratio of 2.89. In contrast, L3Harris Technologies has a trailing 12 month P/E ratio of 30.1 and a P/B ratio of 2.61.
L3Harris Technologies has moved 19.8% over the last year compared to 16.9% for the S&P 500 -- a difference of 2.9%. L3Harris Technologies has a 52 week high of $280.03 and a 52 week low of $193.09.
Increasing Revenues but Narrowing Margins:
| 2018 | 2019 | 2020 | 2021 | 2022 | 2024 | |
|---|---|---|---|---|---|---|
| Revenue (M) | $6,801 | $12,856 | $18,194 | $17,062 | $19,419 | $21,325 |
| Operating Margins | 21% | 12% | 12% | 7% | 7% | 9% |
| Net Margins | 14% | 10% | 6% | 6% | 6% | 7% |
| Net Income (M) | $949 | $1,333 | $1,119 | $1,062 | $1,227 | $1,502 |
| Net Interest Expense (M) | -$167 | -$204 | -$254 | -$279 | -$543 | $354 |
| Depreciation & Amort. (M) | $143 | $442 | $323 | $171 | $387 | $1,289 |
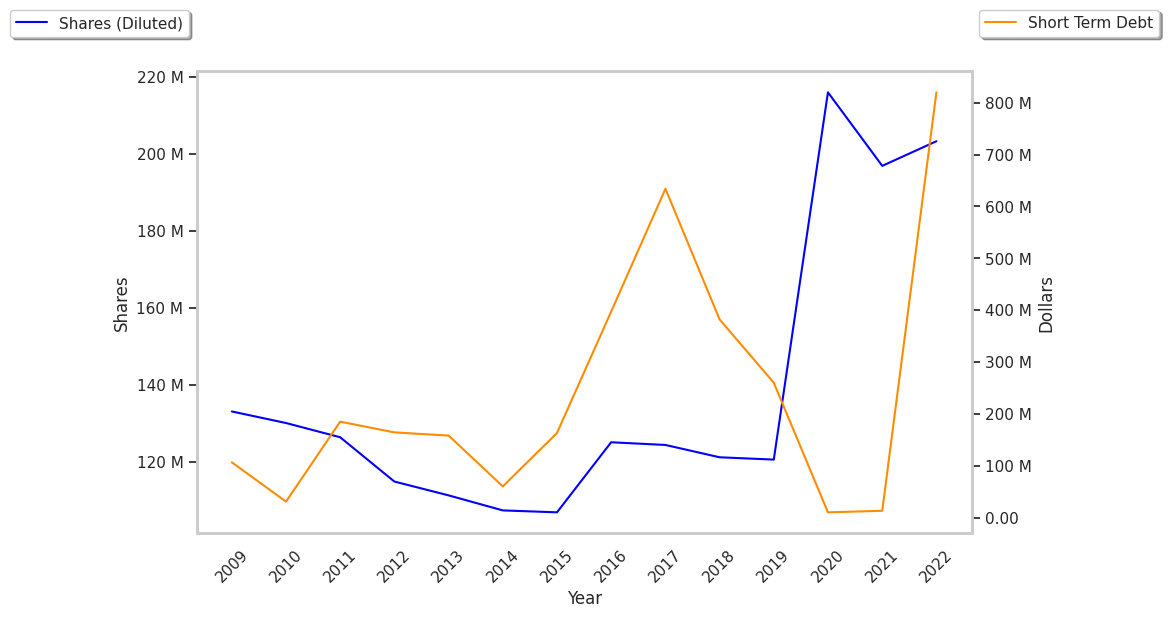
| Diluted Shares (M) | 225 | 215 | 203 | 194 | 191 | 191 |
| Earnings Per Share | $7.86 | $7.89 | $5.19 | $5.49 | $6.44 | $7.87 |
| EPS Growth | n/a | 0.38% | -34.22% | 5.78% | 17.3% | 22.2% |
| Avg. Price | $140.73 | $171.78 | $176.74 | $204.76 | $230.81 | $269.28 |
| P/E Ratio | 17.53 | 21.37 | 33.79 | 36.96 | 35.67 | 34.04 |
| Free Cash Flow (M) | $1,024 | n/a | $2,422 | $1,906 | $1,647 | $2,151 |
| CAPEX (M) | $161 | n/a | $368 | $252 | $449 | $408 |
| EV / EBITDA | 23.53 | 21.93 | 17.08 | 35.2 | 30.25 | 19.28 |
| Total Debt (M) | $6,963 | $6,518 | $7,056 | $7,043 | $11,523 | $11,721 |
| Net Debt / EBITDA | 3.75 | 2.68 | 2.46 | 4.75 | 6.05 | 3.46 |
| Current Ratio | 1.49 | 1.37 | 1.4 | 1.17 | 1.01 | 1.08 |
L3Harris Technologies has flat EPS growth, just enough current assets to cover current liabilities, as shown by its current ratio of 1.08, and significant leverage levels. We also note that the company benefits from rapidly growing revenues and increasing reinvestment in the business and positive cash flows. However, the firm has weak operating margins with a negative growth trend.