Henry Schein shares fell by -1.6% during the day's morning session, and are now trading at a price of $71.46. Is it time to buy the dip? To better answer that question, it's essential to check if the market is valuing the company's shares fairly in terms of its earnings and equity levels.
an Increase in Expected Earnings Improves Its Value Outlook but Trades Above Its Graham Number:
Henry Schein, Inc. provides health care products and services to office-based dental and medical practitioners, and alternate sites of care worldwide. The company belongs to the Health Care sector, which has an average price to earnings (P/E) ratio of 22.94 and an average price to book (P/B) ratio of 3.19. In contrast, Henry Schein has a trailing 12 month P/E ratio of 22.3 and a P/B ratio of 2.64.
Henry Schein has moved -0.0% over the last year compared to 16.9% for the S&P 500 -- a difference of -16.9%. Henry Schein has a 52 week high of $82.49 and a 52 week low of $60.56.
The Firm Has a Declining EPS Growth Trend:
| 2019 | 2020 | 2021 | 2022 | 2023 | 2024 | |
|---|---|---|---|---|---|---|
| Revenue (M) | $9,986 | $10,119 | $12,401 | $12,647 | $12,339 | $12,673 |
| Gross Margins | 31% | 28% | 30% | 30% | 31% | 32% |
| Net Margins | 7% | 4% | 5% | 4% | 3% | 3% |
| Net Income (M) | $695 | $404 | $631 | $566 | $416 | $390 |
| Net Interest Expense (M) | $51 | $41 | $27 | -$44 | $87 | $131 |
| Depreciation & Amort. (M) | $185 | $186 | $210 | $212 | $209 | $83 |
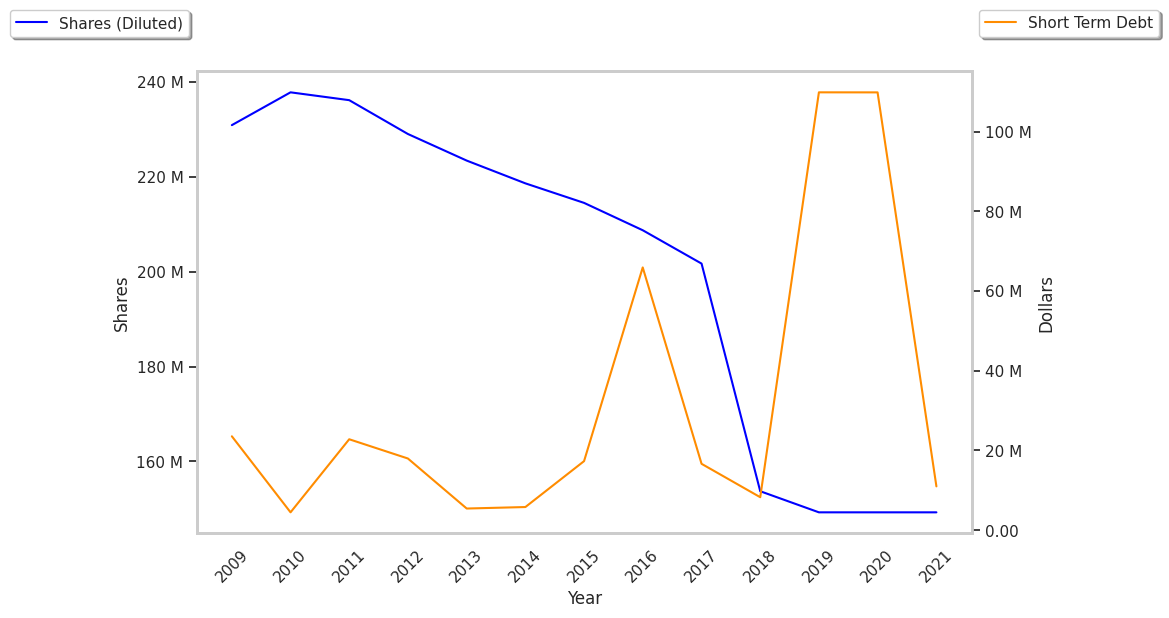
| Diluted Shares (M) | 149 | 143 | 142 | 138 | 132 | 128 |
| Earnings Per Share | $4.65 | $2.82 | $4.45 | $3.91 | $3.16 | $3.05 |
| EPS Growth | n/a | -39.35% | 57.8% | -12.13% | -19.18% | -3.48% |
| Avg. Price | $64.34 | $62.01 | $74.18 | $82.4 | $69.13 | $71.46 |
| P/E Ratio | 13.69 | 21.91 | 16.45 | 21.07 | 21.74 | 23.28 |
| Free Cash Flow (M) | $578 | $550 | $631 | $506 | $353 | $700 |
| CAPEX (M) | $76 | $49 | $79 | $96 | $147 | $148 |
| EV / EBITDA | 11.48 | 12.62 | 10.61 | 12.75 | 13.34 | 15.55 |
| Total Debt (M) | $733 | $626 | $822 | $1,046 | $2,087 | $1,886 |
| Net Debt / EBITDA | 0.69 | 0.28 | 0.66 | 0.97 | 2.33 | 2.51 |
| Current Ratio | 1.58 | 1.66 | 1.67 | 1.79 | 1.67 | 1.42 |