We've been asking ourselves recently if the market has placed a fair valuation on General Motors. Let's dive into some of the fundamental values of this Large-Cap Consumer Discretionary company to determine if there might be an opportunity here for value-minded investors.
General Motors Is Potentially Undervalued and Its Shares Are on Sale:
General Motors Company designs, builds, and sells trucks, crossovers, cars, and automobile parts worldwide. The company belongs to the Consumer Discretionary sector, which has an average price to earnings (P/E) ratio of 20.93 and an average price to book (P/B) ratio of 2.93. In contrast, General Motors has a trailing 12 month P/E ratio of 8.1 and a P/B ratio of 0.77.
General Motors has moved 21.0% over the last year compared to 16.9% for the S&P 500 — a difference of 4.0%. General Motors has a 52 week high of $61.24 and a 52 week low of $38.96.
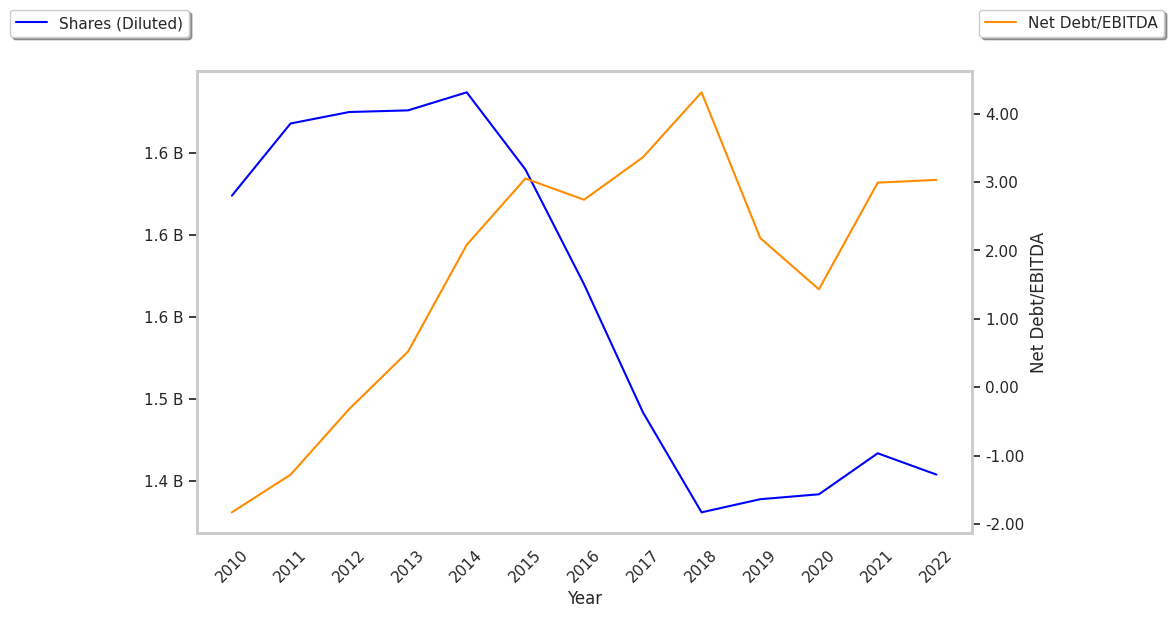
EPS Trend Sustained Primarily by Reducing the Number of Shares Outstanding:
| 2019 | 2020 | 2021 | 2022 | 2023 | 2024 | |
|---|---|---|---|---|---|---|
| Revenue (M) | $137,237 | $122,485 | $127,004 | $156,735 | $171,842 | $187,442 |
| Operating Margins | 4% | 5% | 7% | 7% | 5% | 7% |
| Net Margins | 5% | 5% | 8% | 6% | 6% | 3% |
| Net Income (M) | $6,732 | $6,427 | $10,019 | $9,934 | $10,127 | $6,008 |
| Net Interest Expense (M) | $1,469 | $4,121 | $3,041 | $1,432 | $1,537 | $6,183 |
| Depreciation & Amort. (M) | $14,060 | $12,676 | $12,047 | $11,276 | $11,737 | $11,456 |
| Diluted Shares (M) | 1,439 | 1,442 | 1,468 | 1,454 | 1,369 | 1,129 |
| Earnings Per Share | $4.57 | $4.33 | $6.7 | $6.13 | $7.32 | $6.37 |
| EPS Growth | n/a | -5.25% | 54.73% | -8.51% | 19.41% | -12.98% |
| Avg. Price | $35.91 | $30.12 | $55.35 | $42.86 | $31.04 | $53.4 |
| P/E Ratio | 7.77 | 6.91 | 8.16 | 6.95 | 4.22 | 8.28 |
| Free Cash Flow (M) | $7,429 | $11,370 | $7,679 | $6,805 | $9,960 | $9,299 |
| CAPEX (M) | $7,592 | $5,300 | $7,509 | $9,238 | $10,970 | $10,830 |
| EV / EBITDA | 24.87 | 25.46 | 24.73 | 25.46 | 23.28 | 21.06 |
| Total Debt (M) | $454,447 | $468,621 | $468,904 | $506,545 | $465,293 | $468,723 |
| Net Debt / EBITDA | 22.28 | 23.23 | 21.0 | 22.57 | 21.22 | 18.52 |
| Current Ratio | 0.88 | 1.01 | 1.1 | 1.1 | 1.08 | 1.13 |
General Motors has weak operating margins with a positive growth rate, positive cash flows, and just enough current assets to cover current liabilities, as shown by its current ratio of 1.13. We also note that the company has growing revenues and increasing reinvestment in the business working in its favor. However, the firm suffers from EPS growth achieved by reducing the number of outstanding shares and a highly leveraged balance sheet.