We've been asking ourselves recently if the market has placed a fair valuation on Cognizant Technology Solutions. Let's dive into some of the fundamental values of this Large-Cap Technology company to determine if there might be an opportunity here for value-minded investors.
a Lower P/B Ratio Than Its Sector Average but Its Shares Are Expensive:
Cognizant Technology Solutions Corporation, a professional services company, provides consulting and technology, and outsourcing services in North America, Europe, and internationally. The company belongs to the Technology sector, which has an average price to earnings (P/E) ratio of 30.44 and an average price to book (P/B) ratio of 4.19. In contrast, Cognizant Technology Solutions has a trailing 12 month P/E ratio of 16.0 and a P/B ratio of 2.51.
Cognizant Technology Solutions has moved -0.5% over the last year compared to 17.5% for the S&P 500 -- a difference of -18.1%. Cognizant Technology Solutions has a 52 week high of $90.82 and a 52 week low of $65.52.
Positive Cash Flows:
| 2019 | 2020 | 2021 | 2022 | 2023 | 2024 | |
|---|---|---|---|---|---|---|
| Revenue (M) | $16,783 | $16,652 | $18,507 | $19,428 | $19,353 | $19,736 |
| Operating Margins | 15% | 13% | 15% | 15% | 14% | 15% |
| Net Margins | 11% | 8% | 12% | 12% | 11% | 11% |
| Net Income (M) | $1,842 | $1,392 | $2,137 | $2,290 | $2,126 | $2,240 |
| Net Interest Expense (M) | $26 | $24 | $9 | $19 | $41 | $53 |
| Depreciation & Amort. (M) | $507 | $552 | $574 | $569 | $519 | $529 |
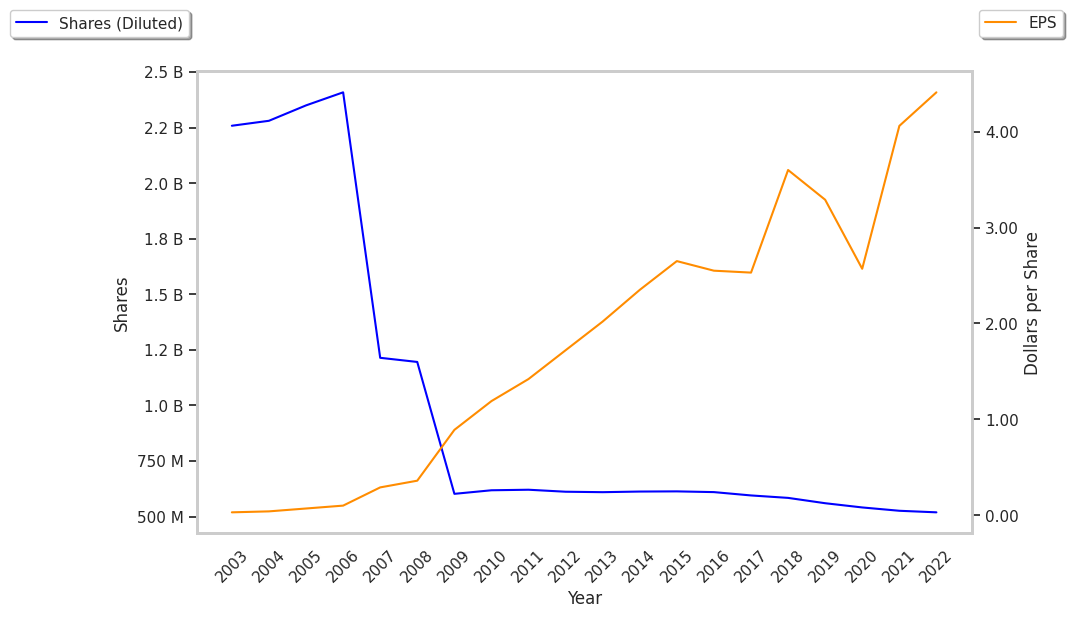
| Diluted Shares (M) | 560 | 541 | 528 | 519 | 505 | 497 |
| Earnings Per Share | $3.29 | $2.57 | $4.05 | $4.41 | $4.21 | $4.51 |
| EPS Growth | n/a | -21.88% | 57.59% | 8.89% | -4.54% | 7.13% |
| Avg. Price | $61.47 | $61.0 | $74.18 | $79.93 | $70.26 | $75.42 |
| P/E Ratio | 18.63 | 23.64 | 18.27 | 18.08 | 16.69 | 16.69 |
| Free Cash Flow (M) | $2,107 | $2,901 | $2,216 | $2,236 | $2,013 | $1,827 |
| CAPEX (M) | $392 | $398 | $279 | $332 | $317 | $297 |
| EV / EBITDA | 11.3 | 11.81 | 11.24 | 11.42 | 10.54 | 10.59 |
| Total Debt (M) | $738 | $701 | $664 | $646 | $639 | $908 |
| Net Debt / EBITDA | -0.64 | -0.74 | -0.33 | -0.44 | -0.62 | -0.39 |
| Current Ratio | 2.55 | 1.94 | 2.08 | 2.17 | 2.25 | 2.09 |
Cognizant Technology Solutions has an excellent current ratio of 2.09 and decent operating margins with a stable trend. Additionally, the company's financial statements display positive EPS growth and healthy leverage levels. However, the firm has positive cash flows. Finally, we note that Cognizant Technology Solutions has growing revenues and decreasing reinvestment in the business.