Dominion Energy logged a 0.5% change during today's morning session, and is now trading at a price of $58.27 per share.
Dominion Energy returned gains of 9.0% last year, with its stock price reaching a high of $61.97 and a low of $48.07. Over the same period, the stock underperformed the S&P 500 index by -8.5%. The company's 50-day average price was $56.48. Dominion Energy, Inc. provides regulated electricity and natural gas services in the United States. Based in Richmond, VA, the Large-Cap Utilities company has 14,700 full time employees. Dominion Energy has returned a 4.6% dividend yield over the last 12 months, but this may not be sustainable seen that the company has a choppy cash flow record.
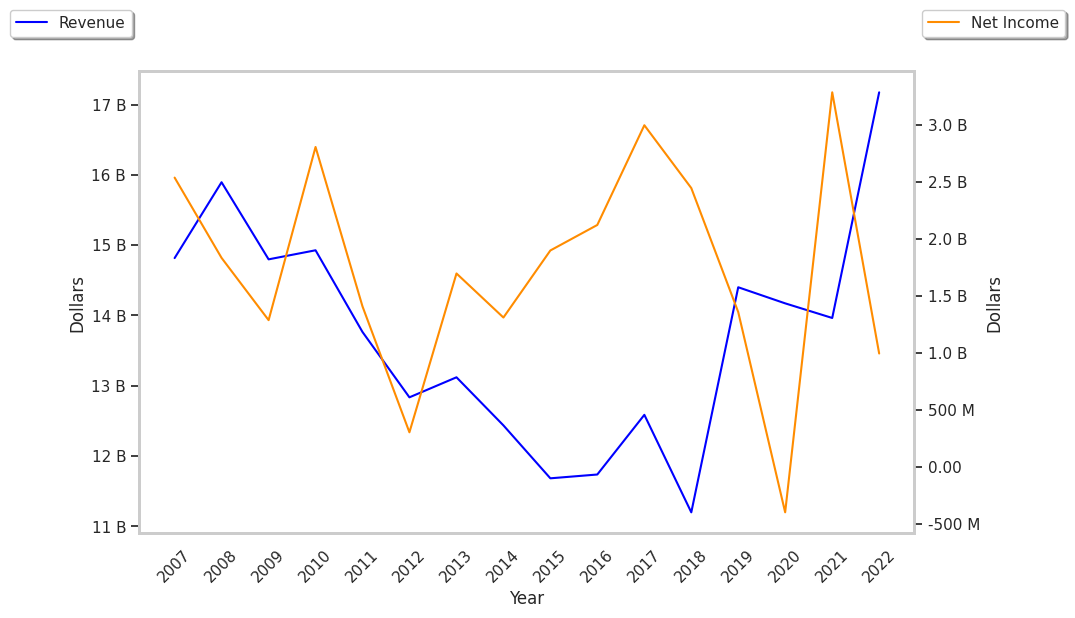
EPS Trend Sustained Primarily by Reducing the Number of Shares Outstanding:
| 2019 | 2020 | 2021 | 2022 | 2023 | 2024 | |
|---|---|---|---|---|---|---|
| Revenue (M) | $14,401 | $11,919 | $11,419 | $13,938 | $14,393 | $14,459 |
| Operating Margins | 11% | 12% | 17% | 10% | 24% | 22% |
| Net Margins | 9% | -3% | 30% | 9% | 14% | 15% |
| Net Income (M) | $1,358 | -$401 | $3,399 | $1,191 | $2,031 | $2,124 |
| Net Interest Expense (M) | $1,486 | $1,339 | $1,255 | $1,002 | $1,674 | $1,887 |
| Depreciation & Amort. (M) | $2,283 | $1,991 | $2,117 | $2,442 | $2,580 | $2,345 |
| Diluted Shares (M) | 8,089 | 831 | 808 | 825 | 836 | 839 |
| Earnings Per Share | $1.62 | -$0.57 | $4.12 | $1.33 | $2.33 | $2.44 |
| EPS Growth | n/a | -135.19% | 822.81% | -67.72% | 75.19% | 4.72% |
| Avg. Price | $65.59 | $71.14 | $69.64 | $77.14 | $46.44 | $58.0 |
| P/E Ratio | 39.51 | -127.04 | 16.9 | 58.0 | 19.93 | 23.77 |
| Free Cash Flow (M) | $224 | $5,227 | $4,037 | $3,700 | $6,572 | -$4,479 |
| EV / EBITDA | 34.96 | 27.55 | 22.0 | 25.19 | 12.07 | 15.84 |
| Total Debt (M) | $29,060 | $34,002 | $34,592 | $35,525 | $33,703 | $40,270 |
| Net Debt / EBITDA | 7.56 | 9.97 | 8.35 | 9.1 | 5.59 | 7.15 |
| Current Ratio | 0.61 | 0.64 | 0.84 | 0.73 | 1.04 | 0.71 |
Dominion Energy's financial statements include several red flags such as EPS growth achieved by reducing the number of outstanding shares, positive cash flows, and not enough current assets to cover current liabilities because its current ratio is 0.71. Additionally, the firm has a highly leveraged balance sheet. On the other hand, the company benefits from slight revenue growth and increasing reinvestment in the business and decent operating margins with a positive growth rate.
a Lower P/B Ratio Than Its Sector Average but Priced Beyond Its Margin of Safety:
Dominion Energy has a trailing twelve month P/E ratio of 21.8, compared to an average of 21.16 for the Utilities sector. Based on its EPS guidance of $3.38, the company has a forward P/E ratio of 16.7. The 11.1% compound average growth rate of Dominion Energy's historical and projected earnings per share yields a PEG ratio of 1.97. This suggests that these shares are overvalued. In contrast, the market is likely undervaluing Dominion Energy in terms of its equity because its P/B ratio is 1.88 while the sector average is 2.36. The company's shares are currently trading 38.0% below their Graham number.
Dominion Energy Has an Average Rating of Hold:
The 13 analysts following Dominion Energy have set target prices ranging from $52.0 to $62.0 per share, for an average of $59.38 with a hold rating. The company is trading -1.9% away from its average target price, indicating that there is an analyst consensus of some upside potential.
Dominion Energy has an average amount of shares sold short because 4.0% of the company's shares are sold short. Institutions own 78.3% of the company's shares, and the insider ownership rate stands at 0.11%, suggesting a small amount of insider investors. The largest shareholder is Vanguard Group Inc, whose 11% stake in the company is worth $5,307,197,553.