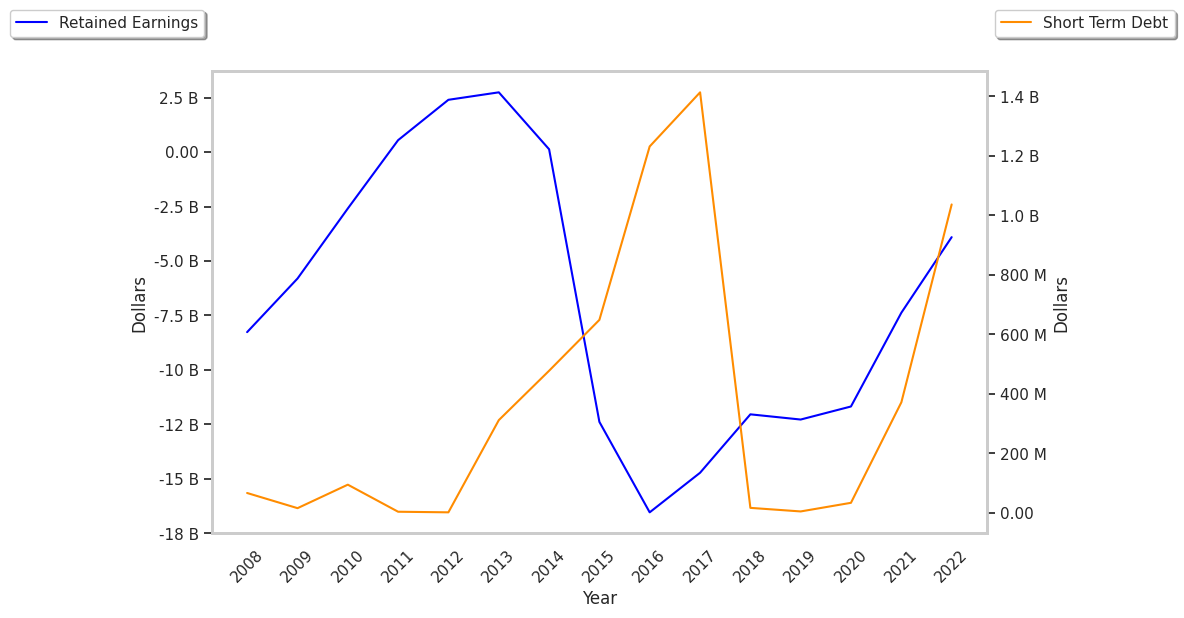
Now trading at a price of $43.19, Freeport-McMoRan has moved -1.3% so far today.
Over the last year, Freeport-McMoRan logged a -0.1% change, with its stock price reaching a high of $52.61 and a low of $27.66. Over the same period, the stock underperformed the S&P 500 index by -17.7%. AThe company's 50-day average price was $42.31. Freeport-McMoRan Inc. engages in the mining of mineral properties in North America, South America, and Indonesia. Based in Phoenix, AZ, the Large-Cap Basic Materials company has 28,500 full time employees. Freeport-McMoRan has offered a 1.4% dividend yield over the last 12 months.
Strong Revenue Growth and Healthy Leverage Levels:
| 2019 | 2020 | 2021 | 2022 | 2023 | 2024 | |
|---|---|---|---|---|---|---|
| Revenue (M) | $14,402 | $14,198 | $22,845 | $22,780 | $22,855 | $25,455 |
| Operating Margins | 8% | 17% | 37% | 31% | 27% | 27% |
| Net Margins | -1% | 6% | 23% | 20% | 16% | 17% |
| Net Income (M) | -$189 | $865 | $5,365 | $4,479 | $3,751 | $4,399 |
| Net Interest Expense (M) | -$620 | -$598 | -$602 | -$560 | -$515 | -$319 |
| Depreciation & Amort. (M) | $1,412 | $1,528 | $1,998 | $2,019 | $2,068 | $2,241 |
| Diluted Shares (M) | 1,457 | 1,461 | 1,482 | 1,451 | 1,443 | 1,445 |
| Earnings Per Share | -$0.17 | $0.41 | $2.9 | $2.39 | $1.28 | $1.3 |
| EPS Growth | n/a | 341.18% | 607.32% | -17.59% | -46.44% | 1.56% |
| Avg. Price | $10.84 | $13.42 | $35.42 | $40.96 | $37.38 | $43.79 |
| P/E Ratio | -63.76 | 32.73 | 12.09 | 17.14 | 29.2 | 33.68 |
| Free Cash Flow (M) | -$1,170 | $1,056 | $5,600 | $1,670 | $455 | $2,352 |
| CAPEX (M) | $2,652 | $1,961 | $2,115 | $3,469 | $4,824 | $4,808 |
| EV / EBITDA | 13.32 | 8.88 | 5.99 | 7.91 | 8.05 | 8.43 |
| Total Debt (M) | $19,647 | $19,388 | $18,528 | $20,203 | $18,078 | $17,855 |
| Net Debt / EBITDA | 7.04 | 3.97 | 1.01 | 1.33 | 1.61 | 1.53 |
| Current Ratio | 2.47 | 2.72 | 2.52 | 2.46 | 2.42 | 2.42 |
Freeport-McMoRan has rapidly growing revenues and increasing reinvestment in the business, strong operating margins with a positive growth rate, and exceptional EPS growth. The company also benefits from generally positive cash flows, an excellent current ratio of 2.42, and healthy leverage levels.
Freeport-McMoRan's Valuation Is in Line With Its Sector Averages:
Freeport-McMoRan has a trailing twelve month P/E ratio of 32.1, compared to an average of 20.25 for the Basic Materials sector. Based on its EPS guidance of $2.16, the company has a forward P/E ratio of 19.6. According to the 45.4% compound average growth rate of Freeport-McMoRan's historical and projected earnings per share, the company's PEG ratio is 0.71. Taking the weighted average of the company's EPS CAGR and the broader market's 5-year projected EPS growth rate, we obtain a normalized growth rate of 20.3%. On this basis, the company's PEG ratio is 1.58. This suggests that these shares are overvalued. Furthermore, Freeport-McMoRan is likely overvalued compared to the book value of its equity, since its P/B ratio of 3.32 is higher than the sector average of 2.31. The company's shares are currently trading 129.0% below their Graham number.
Freeport-McMoRan Has an Average Rating of Buy:
The 18 analysts following Freeport-McMoRan have set target prices ranging from $27.0 to $57.0 per share, for an average of $50.89 with a buy rating. The company is trading -15.1% away from its average target price, indicating that there is an analyst consensus of some upside potential.
Freeport-McMoRan has a very low short interest because 1.8% of the company's shares are sold short. Institutions own 86.8% of the company's shares, and the insider ownership rate stands at 0.67%, suggesting a small amount of insider investors. The largest shareholder is Vanguard Group Inc, whose 9% stake in the company is worth $5,399,951,249.


