Today we're going to take a closer look at Large-Cap Telecommunications company Verizon Communications, whose shares are currently trading at $42.67. We've been asking ourselves whether the company is under or over valued at today's prices... let's perform a brief value analysis to find out!
Verizon Communications Is Currently Under Priced:
Verizon Communications Inc., through its subsidiaries, engages in the provision of communications, technology, information, and entertainment products and services to consumers, businesses, and governmental entities worldwide. The company belongs to the Telecommunications sector, which has an average price to earnings (P/E) ratio of 18.22 and an average price to book (P/B) ratio of 1.86. In contrast, Verizon Communications has a trailing 12 month P/E ratio of 9.9 and a P/B ratio of 1.75.
Verizon Communications has moved 5.8% over the last year compared to 17.5% for the S&P 500 — a difference of -11.7%. Verizon Communications has a 52 week high of $47.36 and a 52 week low of $37.59.
The Company's Revenues Are Declining:
| 2019 | 2020 | 2021 | 2022 | 2023 | 2024 | |
|---|---|---|---|---|---|---|
| Revenue (M) | $131,868 | $128,292 | $133,613 | $136,835 | $133,974 | $134,788 |
| Operating Margins | 23% | 22% | 24% | 22% | 17% | 21% |
| Net Margins | 15% | 14% | 17% | 16% | 9% | 13% |
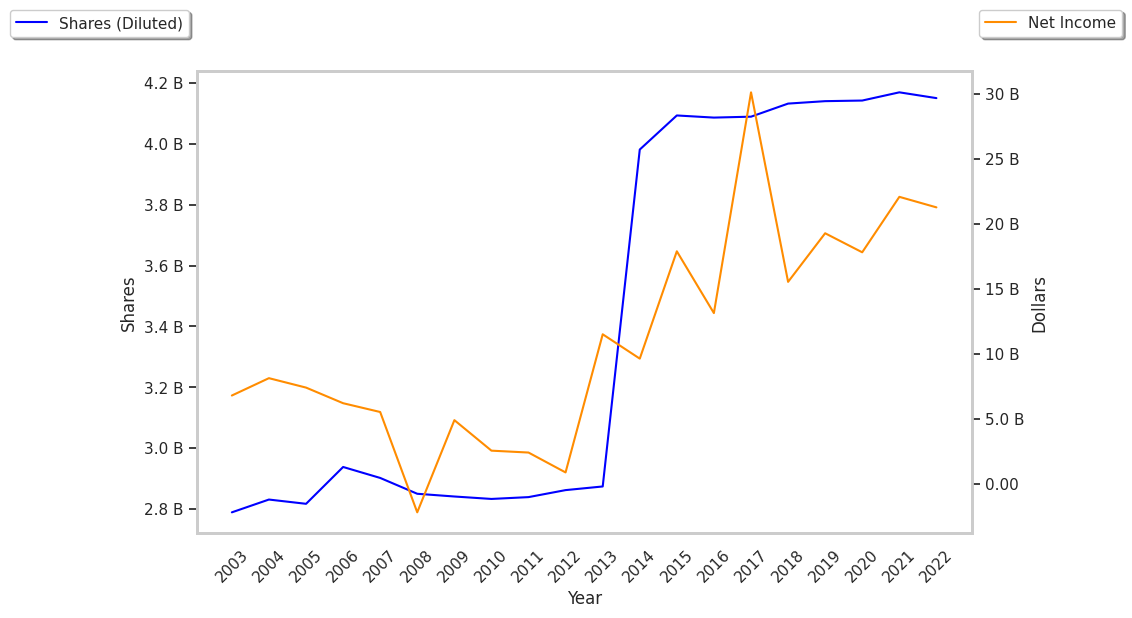
| Net Income (M) | $19,265 | $17,801 | $22,065 | $21,256 | $11,614 | $17,506 |
| Net Interest Expense (M) | $4,730 | $4,247 | $3,485 | $3,613 | $5,524 | $336 |
| Depreciation & Amort. (M) | $16,682 | $16,720 | $16,206 | $17,099 | $17,624 | $15,112 |
| Diluted Shares (M) | 4,140 | 4,142 | 4,150 | 4,204 | 4,215 | 4,223 |
| Earnings Per Share | $4.65 | $4.3 | $5.32 | $5.06 | $2.75 | $4.14 |
| EPS Growth | n/a | -7.53% | 23.72% | -4.89% | -45.65% | 50.55% |
| Avg. Price | $47.21 | $48.98 | $48.98 | $47.48 | $37.07 | $42.36 |
| P/E Ratio | 10.13 | 11.39 | 9.21 | 9.38 | 13.43 | 10.21 |
| Free Cash Flow (M) | $17,807 | $23,576 | $19,253 | $14,054 | $18,708 | $33,612 |
| CAPEX (M) | $17,939 | $18,192 | $20,286 | $23,087 | $18,767 | $3,300 |
| EV / EBITDA | 6.46 | 6.67 | 7.05 | 7.09 | 7.19 | 6.74 |
| Total Debt (M) | $111,489 | $123,173 | $143,425 | $140,676 | $137,701 | $121,381 |
| Net Debt / EBITDA | 2.31 | 2.22 | 2.89 | 2.9 | 3.35 | 2.68 |
| Current Ratio | 0.84 | 1.38 | 0.78 | 0.75 | 0.69 | 0.63 |