Now trading at a price of $301.47, McDonald's has moved -0.4% so far today.
McDonald's returned gains of 14.0% last year, with its stock price reaching a high of $326.32 and a low of $262.4. Over the same period, the stock underperformed the S&P 500 index by -1.3%. The company's 50-day average price was $301.47. McDonald's Corporation owns, operates, and franchises restaurants under the McDonald's brand in the United States and internationally. Based in Chicago, IL, the Large-Cap Consumer Discretionary company has 150,000 full time employees. McDonald's has offered a 2.3% dividend yield over the last 12 months.
Growing Revenues but Significant Leverage Levels:
| 2019 | 2020 | 2021 | 2022 | 2023 | 2024 | |
|---|---|---|---|---|---|---|
| Revenue (M) | $21,364 | $19,208 | $23,223 | $23,183 | $25,494 | $25,920 |
| Operating Margins | 42% | 38% | 45% | 40% | 46% | 45% |
| Net Margins | 28% | 25% | 32% | 27% | 33% | 32% |
| Net Income (M) | $6,025 | $4,730 | $7,545 | $6,177 | $8,469 | $8,223 |
| Net Interest Expense (M) | $1,122 | $1,218 | $1,186 | $1,207 | $1,361 | $1,506 |
| Depreciation & Amort. (M) | $1,618 | $1,751 | $1,868 | $1,871 | $1,978 | $1,500 |
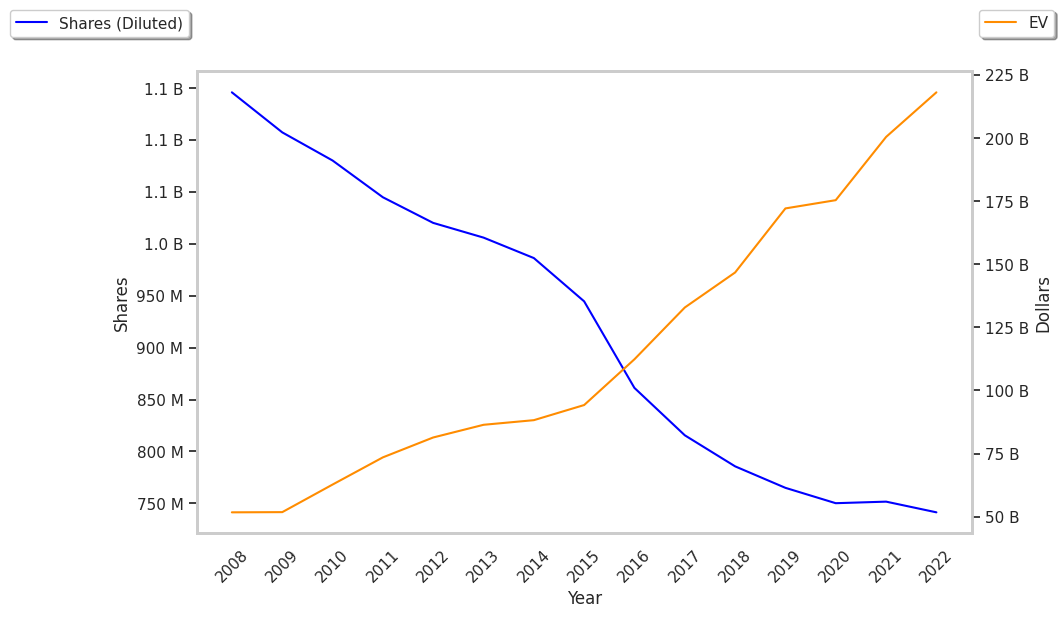
| Diluted Shares (M) | 756 | 750 | 752 | 741 | 732 | 722 |
| Earnings Per Share | $7.88 | $6.31 | $10.04 | $8.33 | $11.56 | $11.39 |
| EPS Growth | n/a | -19.92% | 59.11% | -17.03% | 38.78% | -1.47% |
| Avg. Price | $180.62 | $187.58 | $224.47 | $240.98 | $280.51 | $302.67 |
| P/E Ratio | 22.72 | 29.54 | 22.2 | 28.72 | 24.12 | 26.43 |
| Free Cash Flow (M) | $5,728 | $4,624 | $7,102 | $5,488 | $7,255 | $6,672 |
| CAPEX (M) | $2,394 | $1,641 | $2,040 | $1,899 | $2,357 | $2,775 |
| EV / EBITDA | 16.05 | 19.31 | 16.22 | 18.9 | 17.77 | 19.37 |
| Total Debt (M) | $34,236 | $38,840 | $35,623 | $35,904 | $41,537 | $38,424 |
| Net Debt / EBITDA | 3.12 | 3.9 | 2.53 | 2.96 | 2.71 | 2.83 |
| Current Ratio | 0.98 | 1.01 | 1.78 | 1.43 | 1.16 | 1.19 |
McDonald's has growing revenues and increasing reinvestment in the business and strong operating margins with a stable trend. Additionally, the company's financial statements display generally positive cash flows and positive EPS growth. Furthermore, McDonald's has just enough current assets to cover current liabilities, as shown by its current ratio of 1.19 and significant leverage levels.
The Market May Be Overvaluing McDonald's's Earnings and Assets:
McDonald's has a trailing twelve month P/E ratio of 26.6, compared to an average of 20.93 for the Consumer Discretionary sector. Based on its EPS guidance of $12.61, the company has a forward P/E ratio of 23.9. The 6.9% compound average growth rate of McDonald's's historical and projected earnings per share yields a PEG ratio of 3.83. This suggests that these shares are overvalued. In conclusion, McDonald's's impressive cash flow trend, decent P/B ratio, and reasonable use of leverage demonstrate that the company may still be fairly valued -- despite its elevated earnings multiple.
McDonald's Has an Analyst Consensus of Some Upside Potential:
The 27 analysts following McDonald's have set target prices ranging from $260.0 to $365.0 per share, for an average of $329.15 with a buy rating. The company is trading -8.4% away from its average target price, indicating that there is an analyst consensus of some upside potential.
McDonald's has a very low short interest because 1.2% of the company's shares are sold short. Institutions own 75.8% of the company's shares, and the insider ownership rate stands at 0.23%, suggesting a small amount of insider investors. The largest shareholder is Vanguard Group Inc, whose 10% stake in the company is worth $21,226,229,955.