It hasn't been a great morning session for Schlumberger investors, who have watched their shares sink by -1.9% to a price of $34.95. Some of you might be wondering if it's time to buy the dip. If you are considering this, make sure to check the company's fundamentals first to determine if the shares are fairly valued at today's prices.
Schlumberger Is Currently Undervalued:
Schlumberger Limited engages in the provision of technology for the energy industry worldwide. The company belongs to the Energy sector, which has an average price to earnings (P/E) ratio of 18.35 and an average price to book (P/B) ratio of 1.6. In contrast, Schlumberger has a trailing 12 month P/E ratio of 12.0 and a P/B ratio of 2.33.
Schlumberger has moved -26.2% over the last year compared to 15.4% for the S&P 500 — a difference of -41.6%. Schlumberger has a 52 week high of $48.57 and a 52 week low of $31.11.
Growing Revenues and an Average Current Ratio:
| 2019 | 2020 | 2021 | 2022 | 2023 | 2024 | |
|---|---|---|---|---|---|---|
| Revenue (M) | $32,917 | $23,601 | $22,929 | $28,091 | $33,135 | $36,289 |
| Operating Margins | -32% | -48% | 10% | 15% | 16% | 16% |
| Net Margins | -31% | -45% | 8% | 12% | 13% | 12% |
| Net Income (M) | -$10,137 | -$10,518 | $1,881 | $3,441 | $4,203 | $4,461 |
| Net Interest Expense (M) | $609 | $563 | $539 | $490 | $503 | $512 |
| Depreciation & Amort. (M) | $3,589 | $2,566 | $2,120 | $2,147 | $2,312 | $1,551 |
| Diluted Shares (M) | 1,385 | 1,390 | 1,427 | 1,437 | 1,443 | 1,436 |
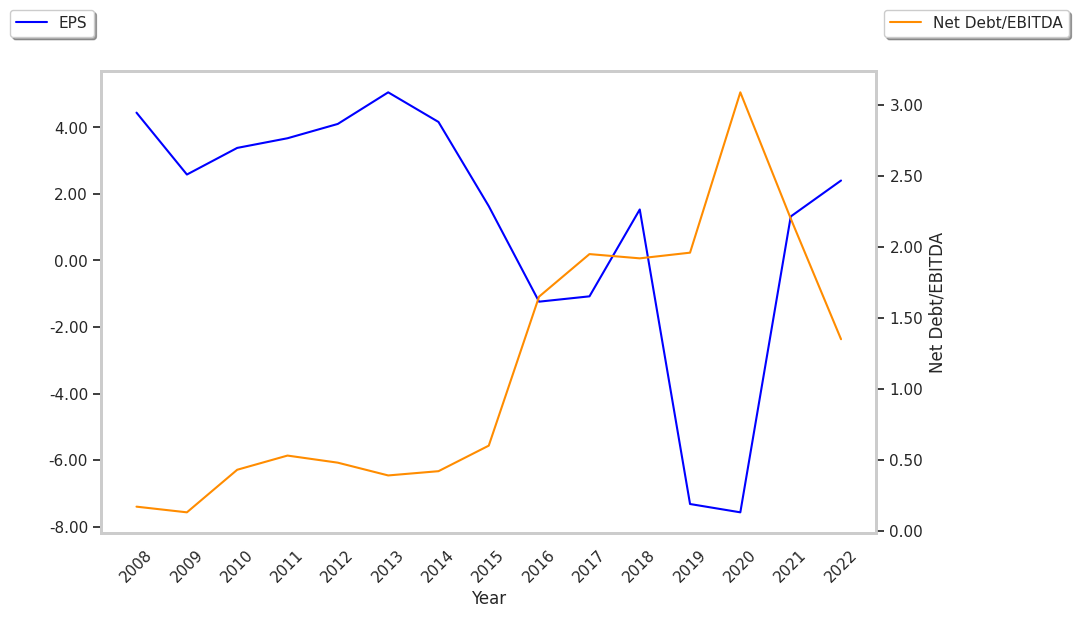
| Earnings Per Share | -$7.32 | -$7.57 | $1.32 | $2.39 | $2.91 | $3.11 |
| EPS Growth | n/a | -3.42% | 117.44% | 81.06% | 21.76% | 6.87% |
| Avg. Price | $34.76 | $19.66 | $28.35 | $39.35 | $52.51 | $35.63 |
| P/E Ratio | -4.75 | -2.6 | 21.16 | 16.19 | 17.8 | 11.35 |
| Free Cash Flow (M) | $3,707 | $1,828 | $3,510 | $2,102 | $4,698 | $4,671 |
| CAPEX (M) | $1,724 | $1,116 | $1,141 | $1,618 | $1,939 | $1,931 |
| EV / EBITDA | -9.12 | -4.97 | 11.62 | 10.35 | 11.06 | 8.09 |
| Total Debt (M) | $15,294 | $16,886 | $14,195 | $12,226 | $11,965 | $12,074 |
| Net Debt / EBITDA | -2.07 | -1.84 | 2.77 | 1.65 | 1.19 | 1.18 |
| Current Ratio | 1.19 | 1.23 | 1.22 | 1.25 | 1.32 | 1.45 |
Schlumberger benefits from strong operating margins with a positive growth rate, growing revenues and a flat capital expenditure trend, and positive EPS growth. The company's financial statements show generally positive cash flows and healthy leverage levels. Furthermore, Schlumberger has just enough current assets to cover current liabilities, as shown by its current ratio of 1.45.