We've been asking ourselves recently if the market has placed a fair valuation on 3M. Let's dive into some of the fundamental values of this Large-Cap Health Care company to determine if there might be an opportunity here for value-minded investors.
a Very Low P/E Ratio but Priced at a Premium:
3M Company provides diversified technology services in the Americas, the Asia Pacific, Europe, the Middle East, Africa, and internationally. The company belongs to the Health Care sector, which has an average price to earnings (P/E) ratio of 22.94 and an average price to book (P/B) ratio of 3.19. In contrast, 3M has a trailing 12 month P/E ratio of 20.4 and a P/B ratio of 18.23.
3M has moved 15.9% over the last year compared to 16.8% for the S&P 500 -- a difference of -0.9%. 3M has a 52 week high of $164.15 and a 52 week low of $119.31.
The Company's Revenues Are Declining:
| 2019 | 2020 | 2021 | 2022 | 2023 | 2024 | |
|---|---|---|---|---|---|---|
| Revenue (M) | $32,136 | $32,184 | $35,355 | $26,161 | $24,610 | $24,575 |
| Operating Margins | 19% | 22% | 21% | 17% | -43% | 20% |
| Net Margins | 14% | 17% | 17% | 22% | -28% | 17% |
| Net Income (M) | $4,517 | $5,449 | $5,921 | $5,777 | -$6,995 | $4,173 |
| Net Interest Expense (M) | $448 | $529 | $488 | $462 | $942 | $472 |
| Depreciation & Amort. (M) | $1,593 | $1,911 | $1,915 | $1,831 | $1,987 | $1,363 |
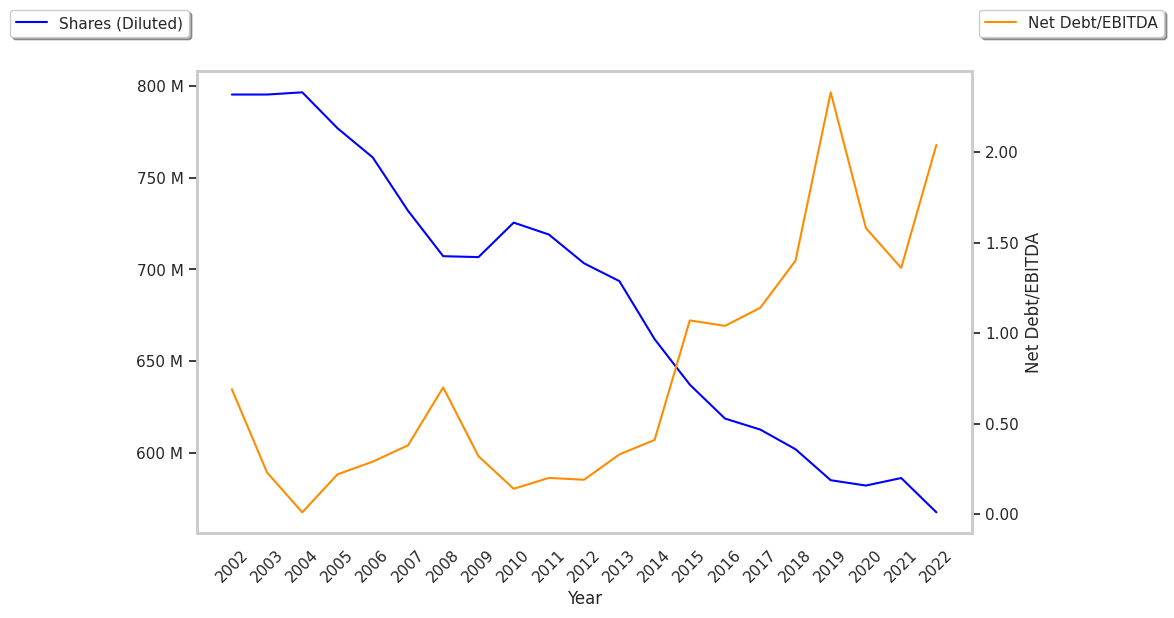
| Diluted Shares (M) | 585 | 582 | 585 | 568 | 554 | 552 |
| Earnings Per Share | $7.72 | $9.36 | $10.12 | $10.18 | -$12.63 | $7.55 |
| EPS Growth | n/a | 21.24% | 8.12% | 0.59% | -224.07% | 159.78% |
| Avg. Price | $153.7 | $141.75 | $172.25 | $142.06 | $98.98 | $146.62 |
| P/E Ratio | 19.63 | 15.03 | 16.84 | 13.91 | -7.84 | 19.34 |
| Free Cash Flow (M) | $5,371 | $6,612 | $5,851 | $3,842 | $5,065 | $638 |
| CAPEX (M) | $1,699 | $1,501 | $1,603 | $1,749 | $1,615 | $1,181 |
| EV / EBITDA | 13.25 | 10.64 | 12.26 | 15.38 | -7.58 | 14.62 |
| Total Debt (M) | $22,154 | $19,589 | $18,654 | $17,877 | $17,187 | $14,963 |
| Net Debt / EBITDA | 1.86 | 1.65 | 1.52 | 2.29 | -1.32 | 1.51 |
| Current Ratio | 1.41 | 1.89 | 1.7 | 1.54 | 1.07 | 1.41 |