Principal Financial logged a 1.4% change during today's morning session, and is now trading at a price of $77.65 per share.
Over the last year, Principal Financial logged a -3.6% change, with its stock price reaching a high of $91.98 and a low of $68.39. Over the same period, the stock underperformed the S&P 500 index by -20.4%. AThe company's 50-day average price was $78.7. Principal Financial Group, Inc. provides retirement, asset management, and insurance products and services to businesses, individuals, and institutional clients worldwide. Based in Des Moines, IA, the Large-Cap Finance company has 19,700 full time employees. Principal Financial has offered a 3.9% dividend yield over the last 12 months.
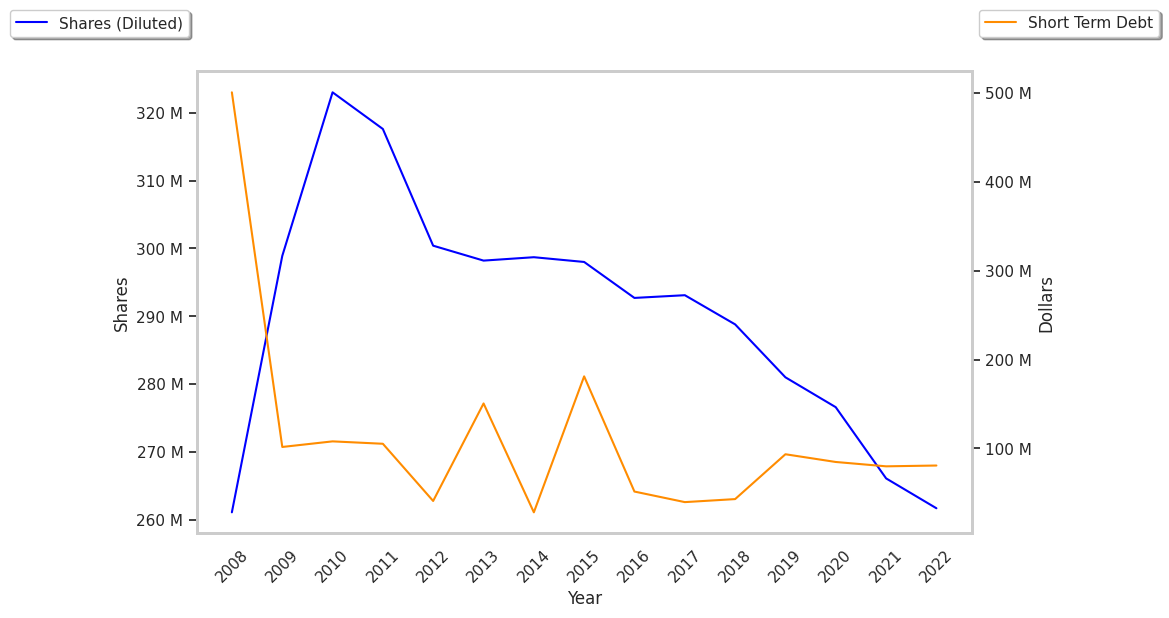
EPS Trend Sustained Primarily by Reducing the Number of Shares Outstanding:
| 2019 | 2020 | 2021 | 2022 | 2023 | 2024 | |
|---|---|---|---|---|---|---|
| Revenue (M) | $16,222 | $14,742 | $14,428 | $17,536 | $13,666 | $16,128 |
| Interest Income (M) | $158 | $163 | $166 | $176 | $171 | $170 |
| Net Margins | 9% | 9% | 11% | 27% | 5% | 10% |
| Net Income (M) | $1,394 | $1,396 | $1,580 | $4,757 | $623 | $1,571 |
| Depreciation & Amort. (M) | $227 | $252 | $275 | $296 | $273 | $256 |
| Diluted Shares (M) | 281 | 277 | 273 | 255 | 245 | 235 |
| Earnings Per Share | $4.96 | $5.05 | $5.79 | $18.63 | $2.55 | $6.68 |
| EPS Growth | n/a | 1.81% | 14.65% | 221.76% | -86.31% | 161.96% |
| Avg. Price | $45.84 | $38.3 | $59.12 | $68.09 | $73.72 | $76.59 |
| P/E Ratio | 9.17 | 7.54 | 10.07 | 3.6 | 28.57 | 11.31 |
| Free Cash Flow (M) | $5,361 | $3,600 | $3,124 | $3,057 | $3,690 | $4,534 |
| CAPEX (M) | $132 | $109 | $130 | $116 | $102 | $69 |
| Total Debt (M) | $3,828 | $4,364 | $4,360 | $4,078 | $3,992 | $4,108 |
| Current Ratio | 26.94 | 33.65 | 29.22 | 60.07 | 77.05 | 27.58 |
Principal Financial Is Reasonably Valued:
Principal Financial has a trailing twelve month P/E ratio of 15.9, compared to an average of 15.92 for the Finance sector. Based on its EPS guidance of $8.44, the company has a forward P/E ratio of 9.3. The 7.9% compound average growth rate of Principal Financial's historical and projected earnings per share yields a PEG ratio of 2.01. This suggests that these shares are overvalued. In contrast, the market is likely undervaluing Principal Financial in terms of its equity because its P/B ratio is 1.52 while the sector average is 1.78. The company's shares are currently trading -7.7% above their Graham number.
Principal Financial Has an Analyst Consensus of Some Upside Potential:
The 12 analysts following Principal Financial have set target prices ranging from $72.0 to $101.0 per share, for an average of $86.75 with a hold rating. The company is trading -10.5% away from its average target price, indicating that there is an analyst consensus of some upside potential.
Principal Financial has an average amount of shares sold short because 2.5% of the company's shares are sold short. Institutions own 75.8% of the company's shares, and the insider ownership rate stands at 1.11%, suggesting a large amount of insider shareholders. The largest shareholder is Vanguard Group Inc, whose 10% stake in the company is worth $2,115,800,641.