PPG Industries logged a 0.9% change during today's morning session, and is now trading at a price of $107.24 per share.
PPG Industries returned losses of -15.6% last year, with its stock price reaching a high of $137.24 and a low of $90.24. Over the same period, the stock underperformed the S&P 500 index by -32.4%. AThe company's 50-day average price was $113.3. PPG Industries, Inc. manufactures and distributes paints, coatings, and specialty materials in the United States, Canada, the Asia Pacific, Latin America, Europe, the Middle East, and Africa. Based in Pittsburgh, PA, the Large-Cap Consumer Discretionary company has 46,000 full time employees. PPG Industries has offered a 2.6% dividend yield over the last 12 months.
Positive Cash Flows:
| 2019 | 2020 | 2021 | 2022 | 2023 | 2024 | |
|---|---|---|---|---|---|---|
| Revenue (M) | $15,146 | $13,834 | $16,802 | $15,614 | $16,242 | $15,845 |
| Operating Margins | 11% | 10% | 11% | 9% | 10% | 12% |
| Net Margins | 8% | 8% | 9% | 7% | 8% | 7% |
| Net Income (M) | $1,243 | $1,059 | $1,439 | $1,026 | $1,270 | $1,116 |
| Net Interest Expense (M) | $132 | $138 | $121 | $167 | $247 | $247 |
| Depreciation & Amort. (M) | $375 | $371 | $389 | $357 | $360 | $360 |
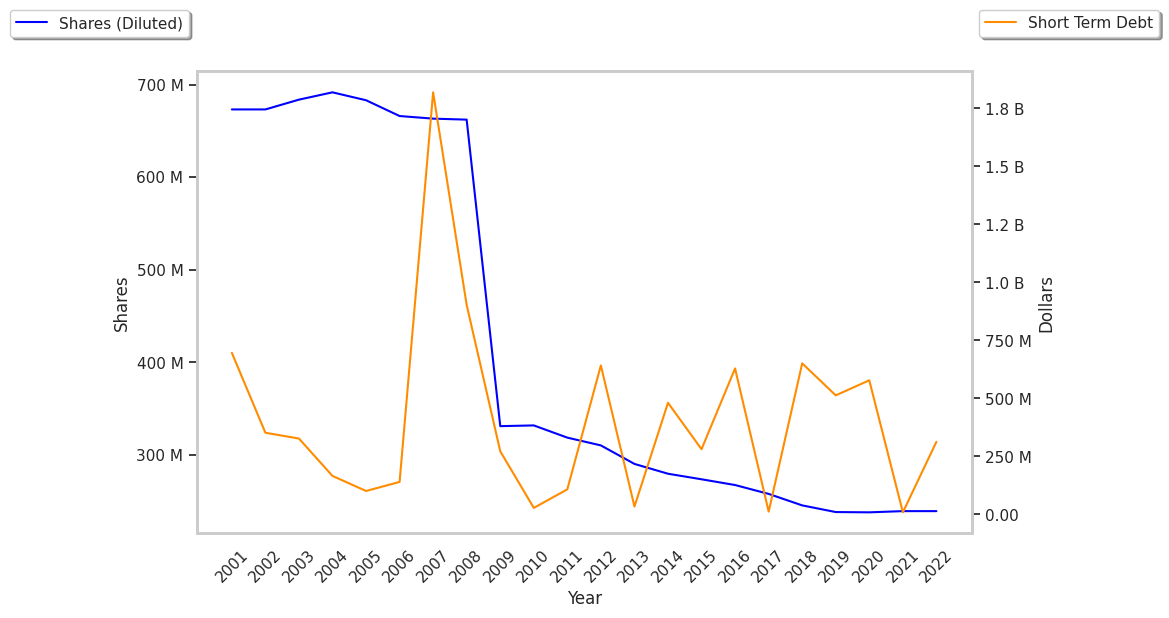
| Diluted Shares (M) | 238 | 238 | 239 | 237 | 237 | 235 |
| Earnings Per Share | $5.22 | $4.45 | $6.01 | $4.32 | $5.35 | $4.75 |
| EPS Growth | n/a | -14.75% | 35.06% | -28.12% | 23.84% | -11.21% |
| Avg. Price | $108.19 | $110.3 | $153.67 | $131.34 | $138.79 | $106.25 |
| P/E Ratio | 20.53 | 24.57 | 25.27 | 30.19 | 25.7 | 22.42 |
| Free Cash Flow (M) | $1,667 | $1,826 | $1,191 | $477 | $1,895 | $699 |
| CAPEX (M) | $413 | $304 | $371 | $486 | $516 | $721 |
| EV / EBITDA | 14.66 | 17.36 | 19.04 | 21.62 | 18.29 | 13.77 |
| Total Debt (M) | $5,544 | $5,912 | $6,574 | $7,109 | $6,348 | $6,740 |
| Net Debt / EBITDA | 2.13 | 2.36 | 2.53 | 3.51 | 2.37 | 2.47 |
| Current Ratio | 1.41 | 1.41 | 1.42 | 1.52 | 1.47 | 1.31 |
PPG Industries has slight revenue growth and increasing reinvestment in the business, decent operating margins with a stable trend, and healthy leverage levels. However, the firm has positive cash flows. Finally, we note that PPG Industries has flat EPS growth and just enough current assets to cover current liabilities, as shown by its current ratio of 1.31.
an Increase in Expected Earnings Improves Its Value Outlook but Its Shares Are Expensive:
PPG Industries has a trailing twelve month P/E ratio of 20.5, compared to an average of 20.93 for the Consumer Discretionary sector. Based on its EPS guidance of $8.85, the company has a forward P/E ratio of 12.8. The 7.8% compound average growth rate of PPG Industries's historical and projected earnings per share yields a PEG ratio of 2.62. This suggests that these shares are overvalued. Furthermore, PPG Industries is likely overvalued compared to the book value of its equity, since its P/B ratio of 3.51 is higher than the sector average of 2.93. The company's shares are currently trading 93.0% below their Graham number.
PPG Industries Has an Average Rating of Buy:
The 20 analysts following PPG Industries have set target prices ranging from $105.0 to $145.0 per share, for an average of $127.05 with a buy rating. The company is trading -15.6% away from its average target price, indicating that there is an analyst consensus of some upside potential.
PPG Industries has an average amount of shares sold short because 2.2% of the company's shares are sold short. Institutions own 87.2% of the company's shares, and the insider ownership rate stands at 0.14%, suggesting a small amount of insider investors. The largest shareholder is Vanguard Group Inc, whose 13% stake in the company is worth $3,117,767,975.