Now trading at a price of $63.68, W. P. Carey has moved 0.0% so far today.
W. P. Carey returned gains of 11.1% last year, with its stock price reaching a high of $66.64 and a low of $52.91. Over the same period, the stock underperformed the S&P 500 index by -5.7%. The company's 50-day average price was $62.77. W. P. Carey ranks among the largest net lease REITs with a well-diversified portfolio of high-quality, operationally critical commercial real estate, which includes 1,614 net lease properties covering approximately 177 million square feet and a portfolio of 78 self-storage operating properties as of March 31, 2025. With offices in New York, London, Amsterdam and Dallas, the company remains focused on investing primarily in single-tenant, industrial, warehouse and retail properties located in the U. Based in New York, NY, the Large-Cap Real Estate company has 203 full time employees. W. P. Carey has offered a 5.6% dividend yield over the last 12 months.
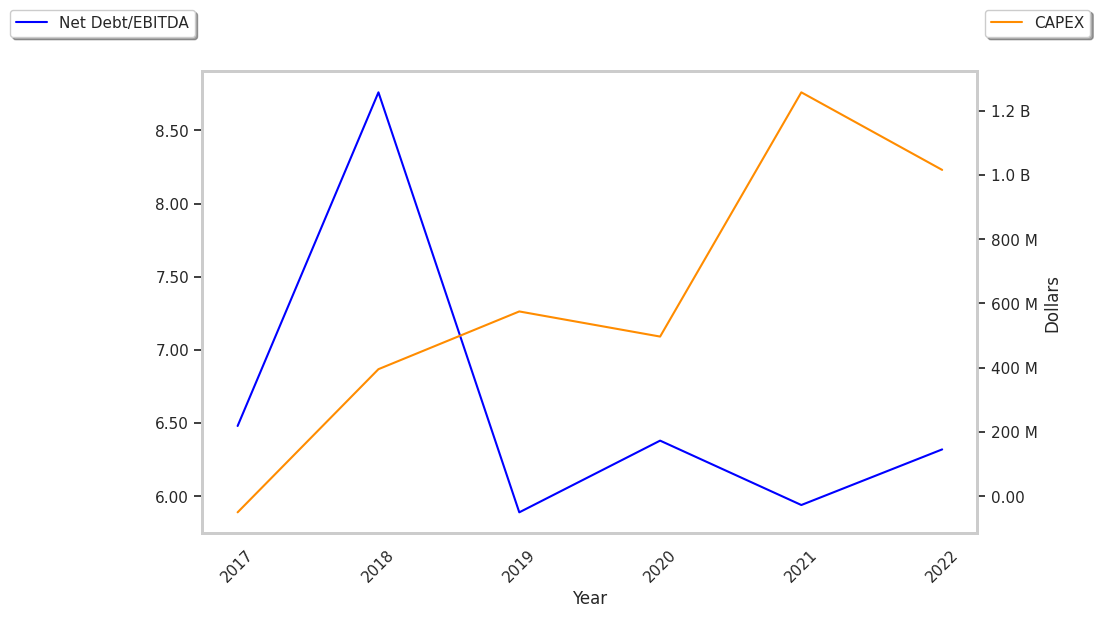
Exceptional EPS Growth at the Expense of a Highly Leveraged Balance Sheet:
| 2019 | 2020 | 2021 | 2022 | 2023 | 2024 | |
|---|---|---|---|---|---|---|
| Revenue (M) | $1,233 | $1,209 | $1,332 | $1,479 | $1,741 | $1,583 |
| Operating Margins | 27% | 37% | 33% | 42% | 43% | 31% |
| Net Margins | 25% | 38% | 31% | 41% | 41% | 28% |
| Net Income (M) | $305 | $455 | $410 | $599 | $708 | $461 |
| Net Interest Expense (M) | $233 | $210 | $197 | $219 | $292 | $257 |
| Depreciation & Amort. (M) | $447 | $443 | $476 | $503 | $574 | $488 |
| Diluted Shares (M) | 171 | 175 | 183 | 200 | 216 | 221 |
| Earnings Per Share | $0.24 | $2.6 | $2.24 | $2.99 | $3.28 | $2.09 |
| EPS Growth | n/a | 983.33% | -13.85% | 33.48% | 9.7% | -36.28% |
| Avg. Price | $64.88 | $58.12 | $66.65 | $74.54 | $59.97 | $63.67 |
| P/E Ratio | 270.33 | 22.35 | 29.75 | 24.93 | 18.28 | 30.46 |
| Free Cash Flow (M) | $647 | $594 | $926 | $1,004 | $1,073 | $1,833 |
| EV / EBITDA | 21.33 | 18.53 | 20.03 | 19.4 | 15.18 | 21.76 |
| Total Debt (M) | $6,054 | $6,696 | $6,792 | $7,878 | $8,144 | $8,039 |
| Net Debt / EBITDA | 7.51 | 7.26 | 7.24 | 6.83 | 5.66 | 7.55 |
W. P. Carey's Valuation Is in Line With Its Sector Averages:
W. P. Carey has a trailing twelve month P/E ratio of 41.3, compared to an average of 27.31 for the Real Estate sector. Based on its EPS guidance of $2.19, the company has a forward P/E ratio of 28.7. According to the 37.1% compound average growth rate of W. P. Carey's historical and projected earnings per share, the company's PEG ratio is 1.11. Taking the weighted average of the company's EPS CAGR and the broader market's 5-year projected EPS growth rate, we obtain a normalized growth rate of 18.5%. On this basis, the company's PEG ratio is 2.23. This suggests that these shares are overvalued. In contrast, the market is likely undervaluing W. P. Carey in terms of its equity because its P/B ratio is 1.7 while the sector average is 1.94. The company's shares are currently trading 50.2% below their Graham number.
W. P. Carey Has an Average Rating of Hold:
The 11 analysts following W. P. Carey have set target prices ranging from $60.0 to $70.0 per share, for an average of $64.91 with a hold rating. The company is trading -1.9% away from its average target price, indicating that there is an analyst consensus of some upside potential.
W. P. Carey has an average amount of shares sold short because 2.5% of the company's shares are sold short. Institutions own 72.5% of the company's shares, and the insider ownership rate stands at 1.26%, suggesting a large amount of insider shareholders. The largest shareholder is Vanguard Group Inc, whose 14% stake in the company is worth $1,957,959,544.