International Paper shares fell by -2.2% during the day's morning session, and are now trading at a price of $45.71. Is it time to buy the dip? To better answer that question, it's essential to check if the market is valuing the company's shares fairly in terms of its earnings and equity levels.
a Lower P/B Ratio Than Its Sector Average but Trades Above Its Graham Number:
International Paper Company produces and sells renewable fiber-based packaging and pulp products in North America, Latin America, Europe, and North Africa. The company belongs to the Basic Materials sector, which has an average price to earnings (P/E) ratio of 20.25 and an average price to book (P/B) ratio of 2.31. In contrast, International Paper has a trailing 12 month P/E ratio of -761.8 and a P/B ratio of 1.32.
International Paper has moved 1.7% over the last year compared to 18.6% for the S&P 500 -- a difference of -16.8%. International Paper has a 52 week high of $60.36 and a 52 week low of $43.27.
The Company's Revenues Are Declining:
| 2019 | 2020 | 2021 | 2022 | 2023 | 2024 | |
|---|---|---|---|---|---|---|
| Revenue (M) | $18,317 | $17,565 | $19,363 | $21,161 | $18,916 | $18,619 |
| Operating Margins | 5% | 2% | 5% | 7% | 2% | 1% |
| Net Margins | 7% | 3% | 9% | 7% | 2% | 3% |
| Net Income (M) | $1,220 | $482 | $1,752 | $1,504 | $288 | $557 |
| Net Interest Expense (M) | -$499 | -$446 | -$337 | -$325 | -$231 | -$208 |
| Depreciation & Amort. (M) | $1,072 | $1,091 | $1,097 | $1,040 | $1,432 | $1,300 |
| Diluted Shares (M) | 399 | 396 | 392 | 367 | 349 | 354 |
| Earnings Per Share | $3.07 | $1.22 | $4.47 | $4.1 | $0.82 | $1.57 |
| EPS Growth | n/a | -60.26% | 266.39% | -8.28% | -80.0% | 91.46% |
| Avg. Price | $34.76 | $32.74 | $48.32 | $43.4 | $35.07 | $46.74 |
| P/E Ratio | 11.21 | 26.62 | 10.74 | 10.48 | 42.25 | 29.21 |
| Free Cash Flow (M) | $2,473 | $2,400 | $1,550 | $1,243 | $692 | $757 |
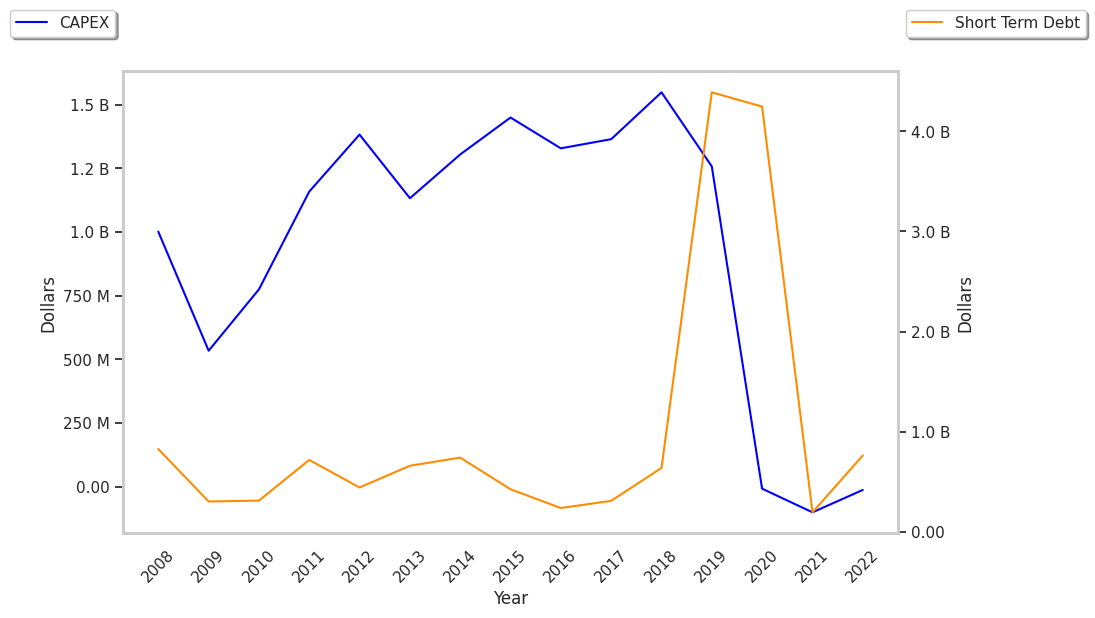
| CAPEX (M) | $1,137 | $663 | $480 | $931 | $1,141 | $921 |
| EV / EBITDA | 11.62 | 14.3 | 10.72 | 7.83 | 9.22 | 14.22 |
| Total Debt (M) | $9,765 | $8,068 | $5,579 | $5,579 | $5,593 | $5,561 |
| Net Debt / EBITDA | 4.64 | 5.26 | 2.04 | 1.87 | 2.47 | 3.03 |
| Current Ratio | 0.77 | 1.36 | 1.71 | 1.35 | 1.67 | 1.51 |
International Paper's financial statements include several red flags such as slight revenue growth and decreasing reinvestment in the business, weak operating margins with a negative growth trend, and declining EPS growth. Additionally, the firm has positive cash flows. On the other hand, the company has a decent current ratio of 1.51 working in its favor. Furthermore, International Paper has significant leverage levels.